

Since July 2024, the Azure Log Alerts support for Azure Data Explorer is generally available, and you might be familiar with log alerts already by using them with Log Analytics or Application Insights.
-> https://azure.microsoft.com/en-us/updates/?id=log-alerts-for-azure-data-explorer
Hence, we will focus on specific configuration best practices and a hidden gem that allows you to easily write your KQL queries in this blog post.
Prerequisites
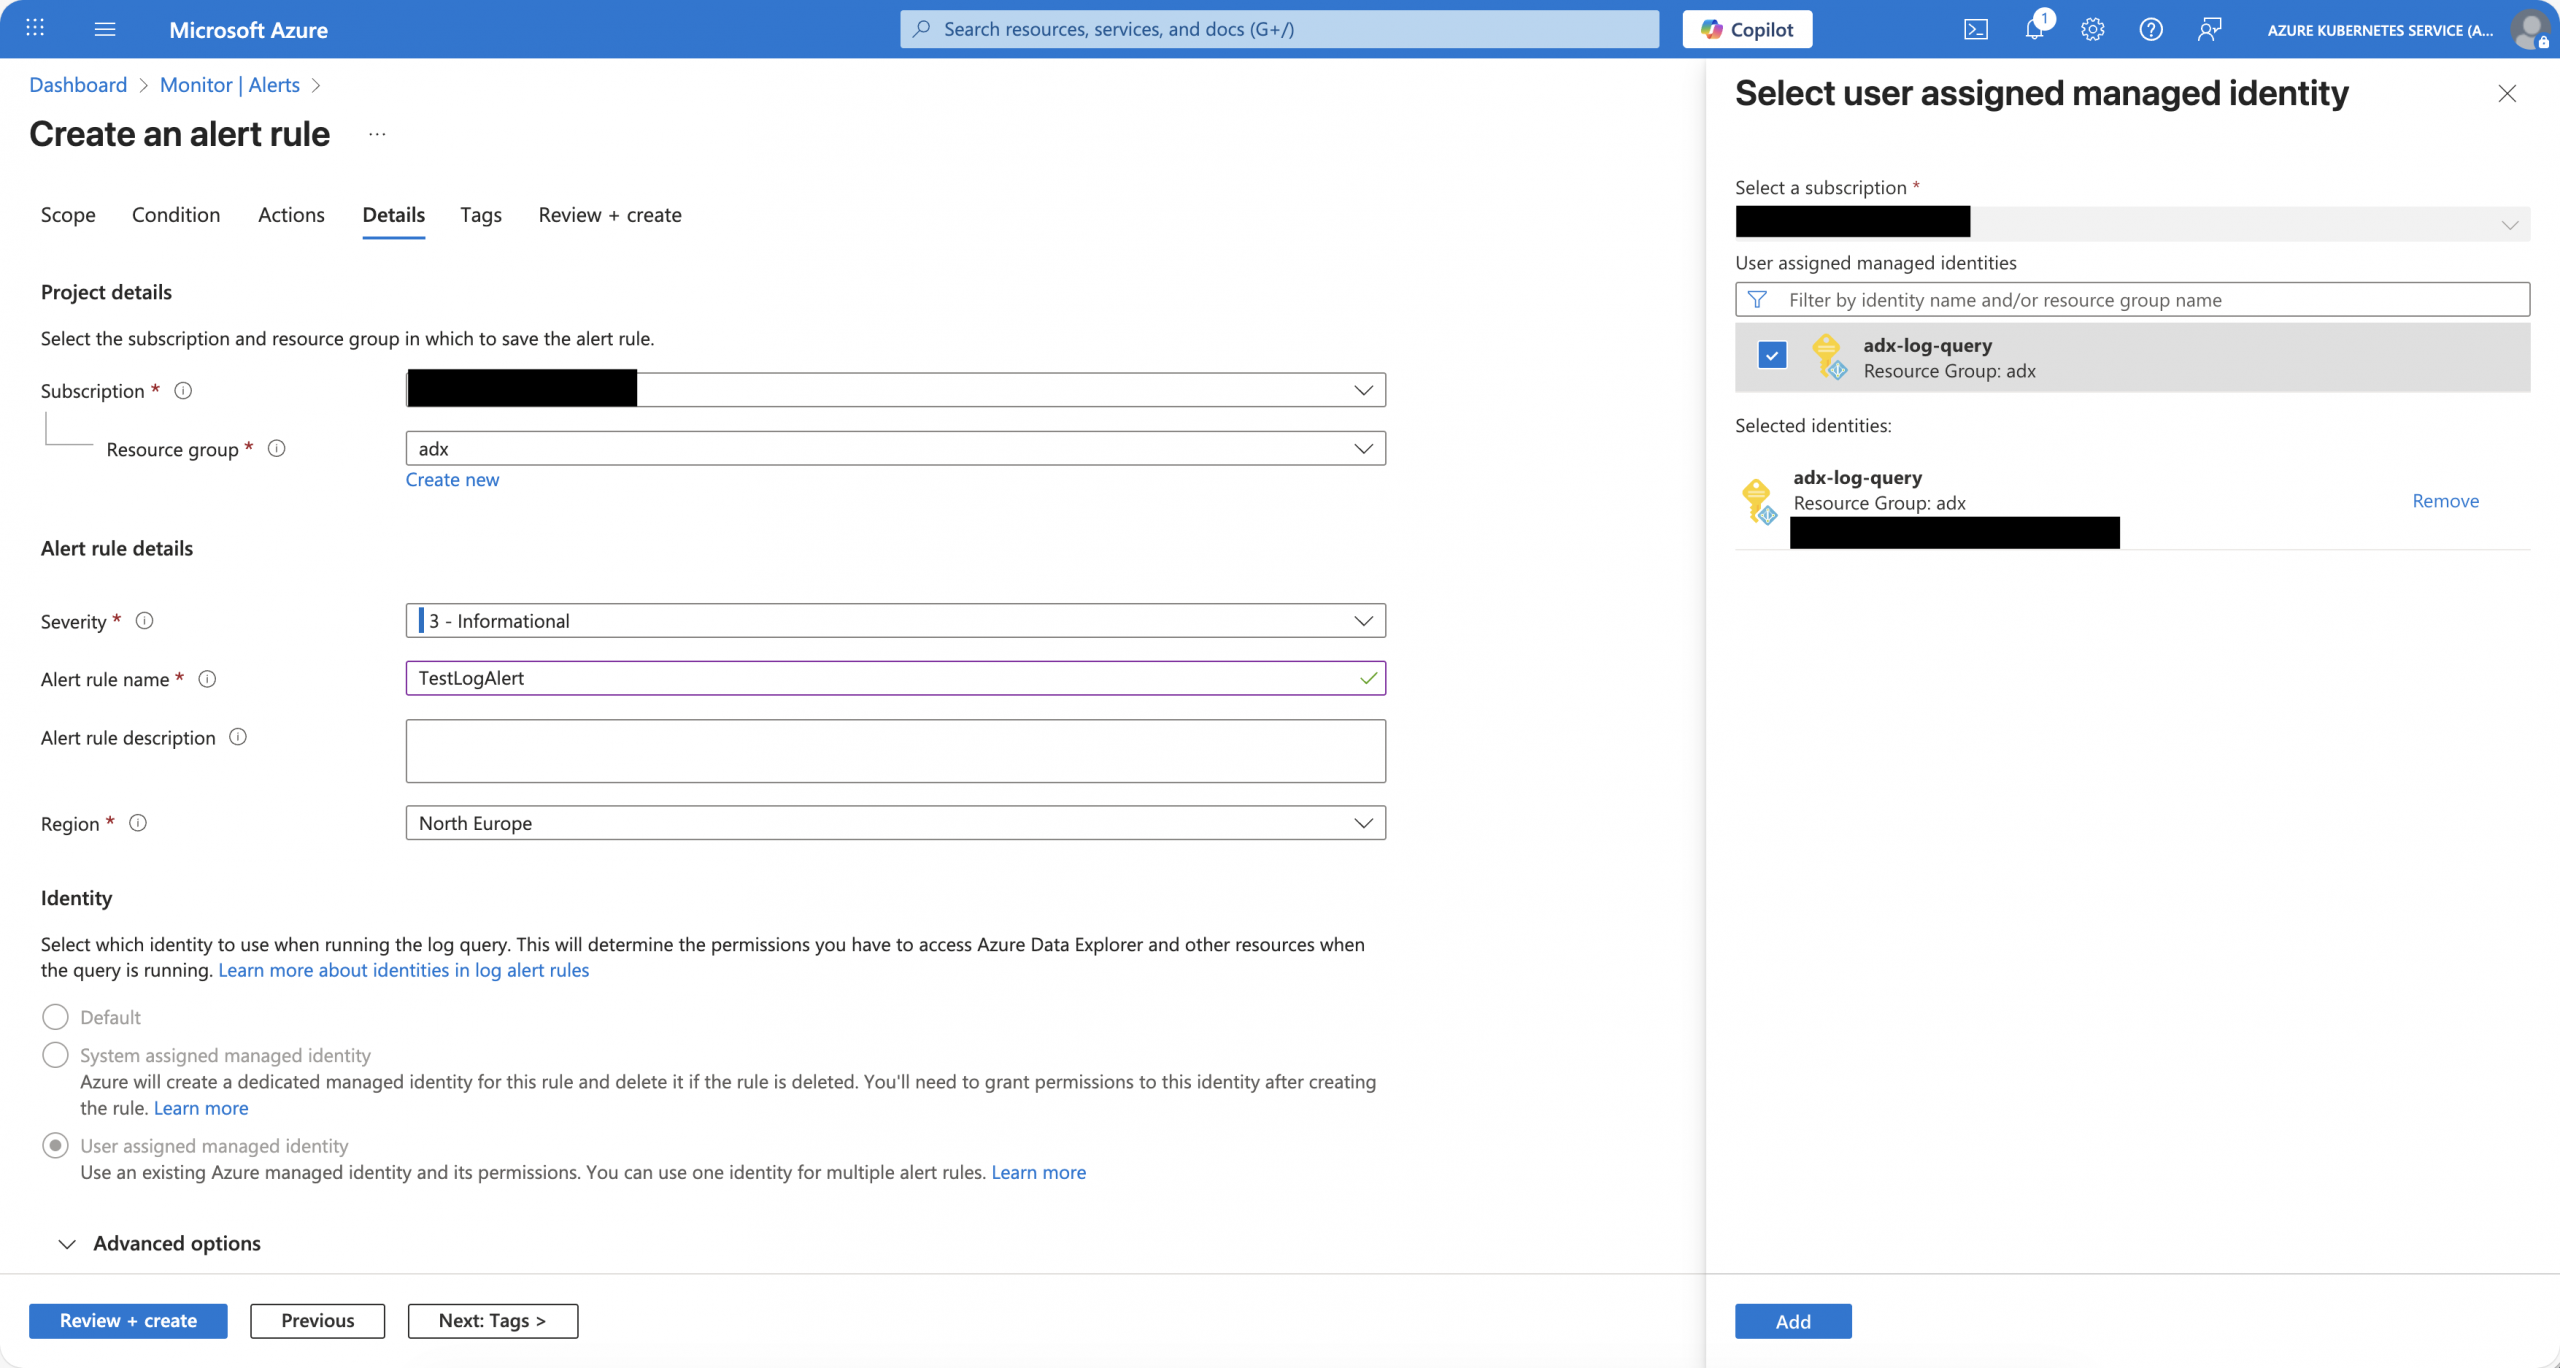
Before we start to create log alerts, we create a user-assigned managed identity, which we will use later as the identity for the log alerts.
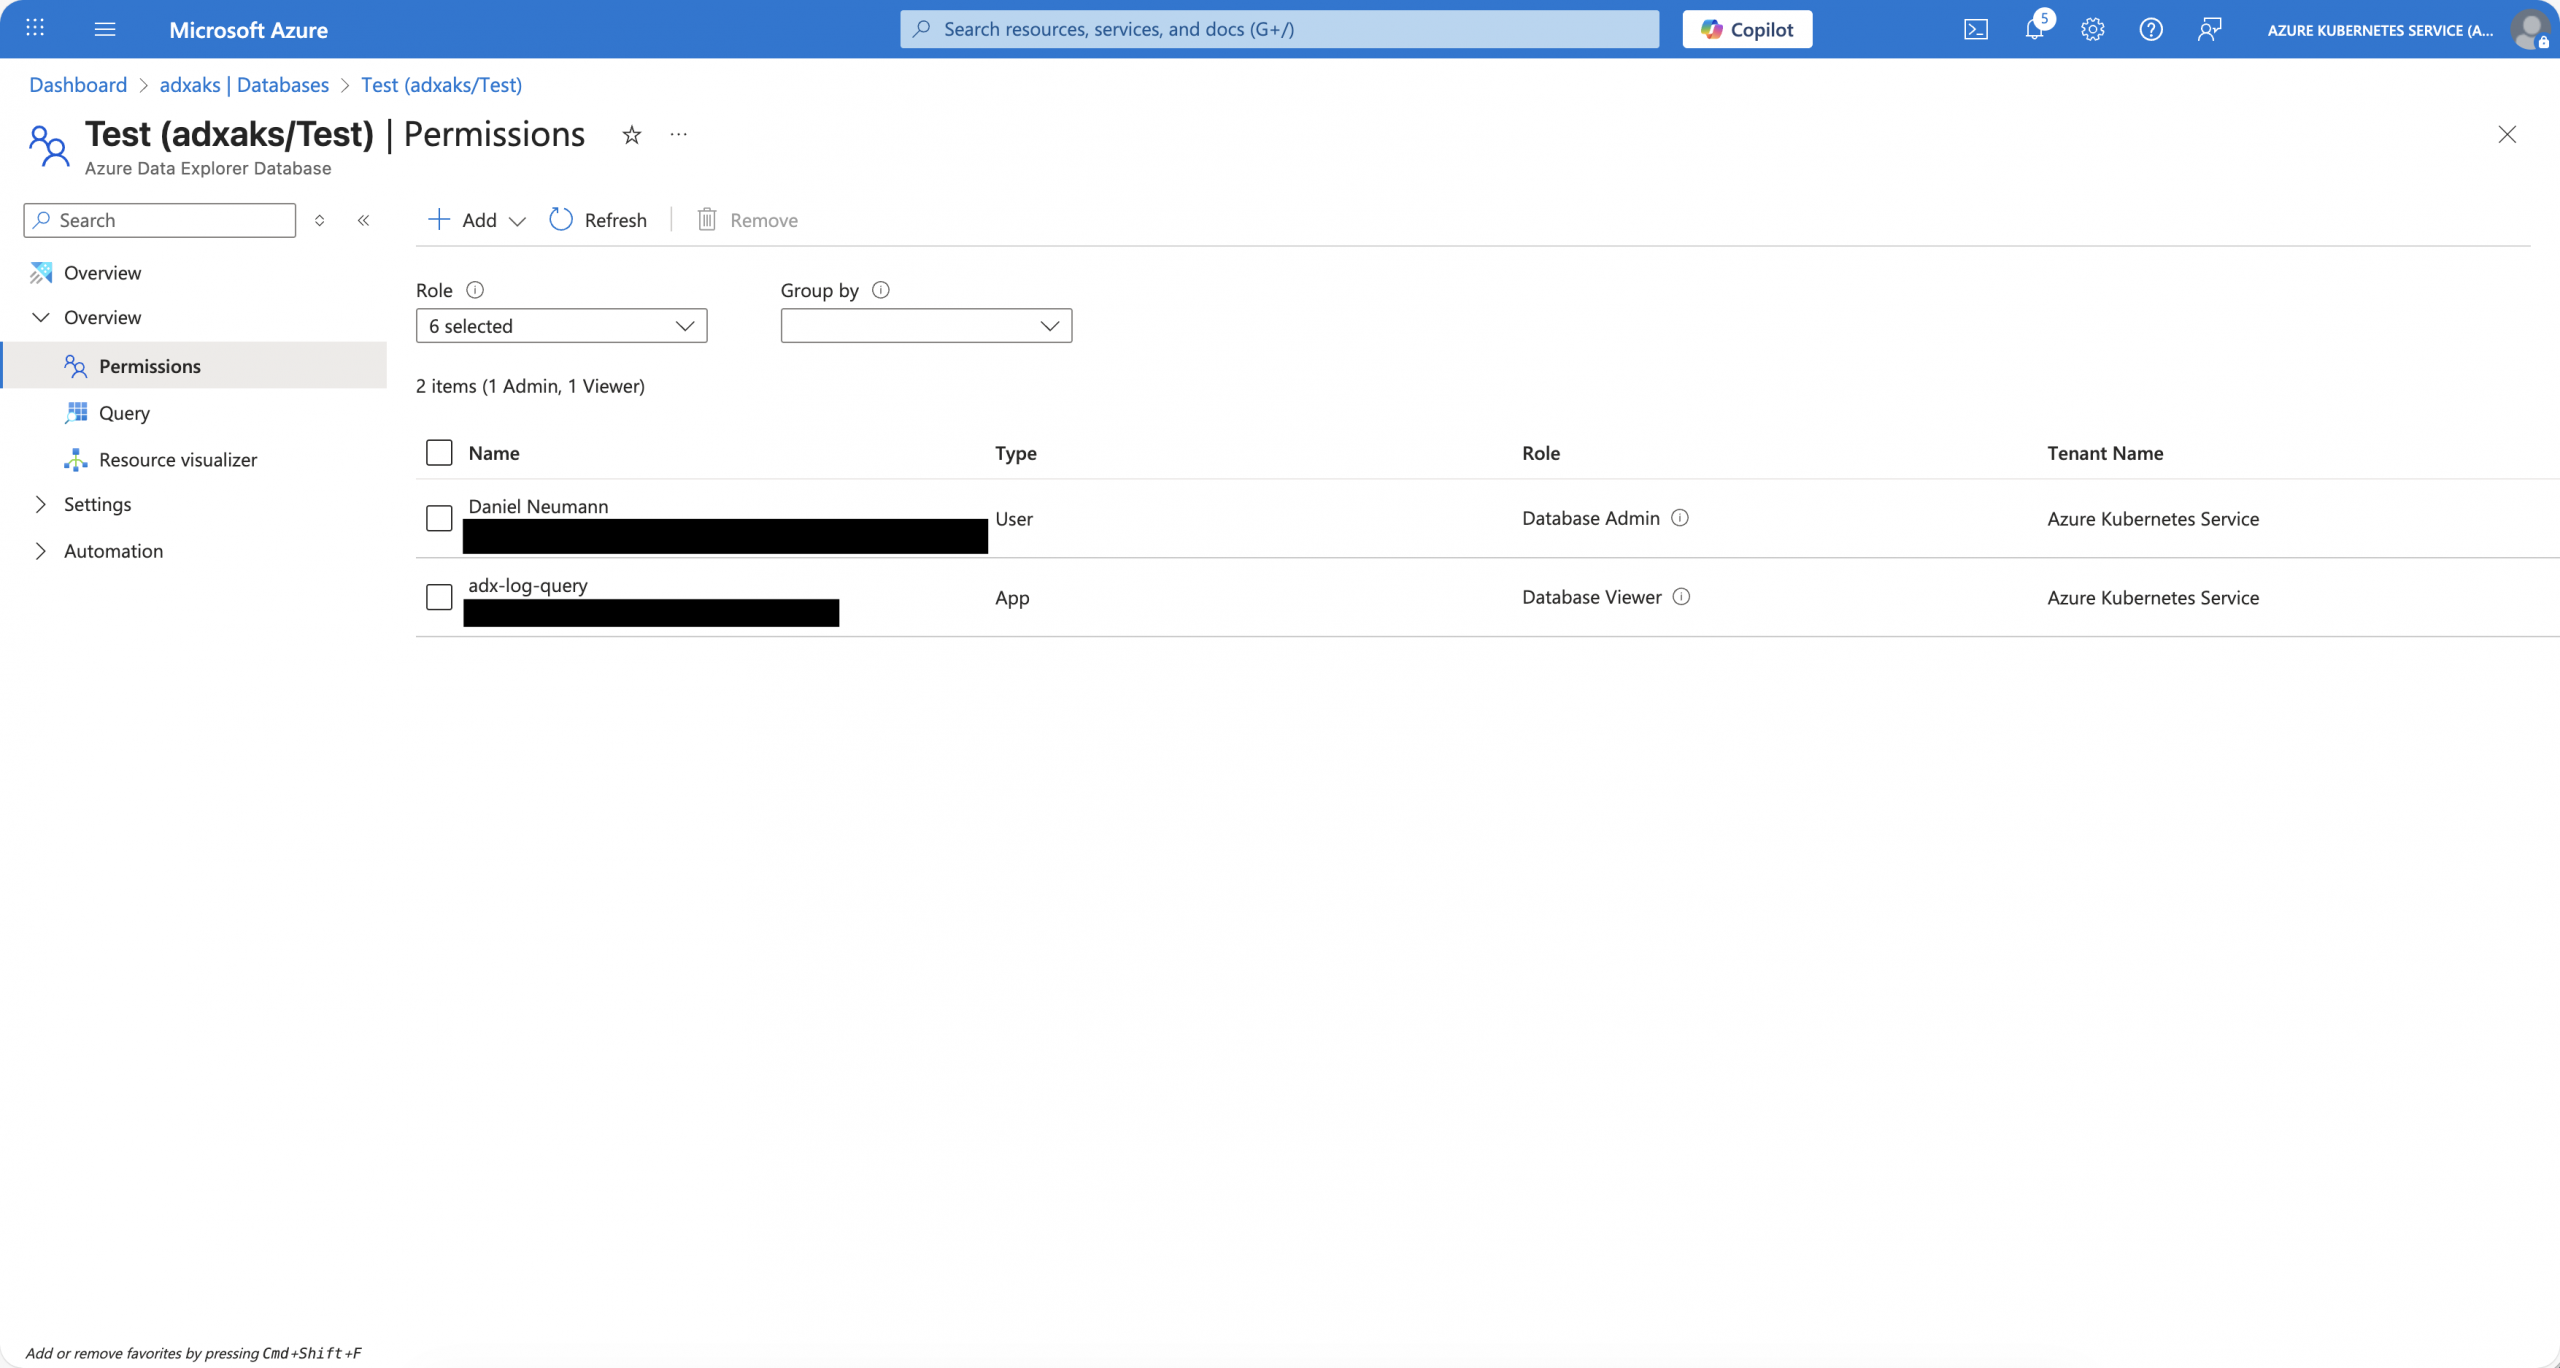
After we created the user-assigned managed identity, we need to assign access permissions to it.
The first one is the Reader role on the Azure Data Explorer cluster itself. Depending on what you want, you either need one additional assignment or multiple ones. So, what do I mean by this? You can grant the user-assigned managed identity either database viewer permissions on the cluster or on individual databases.
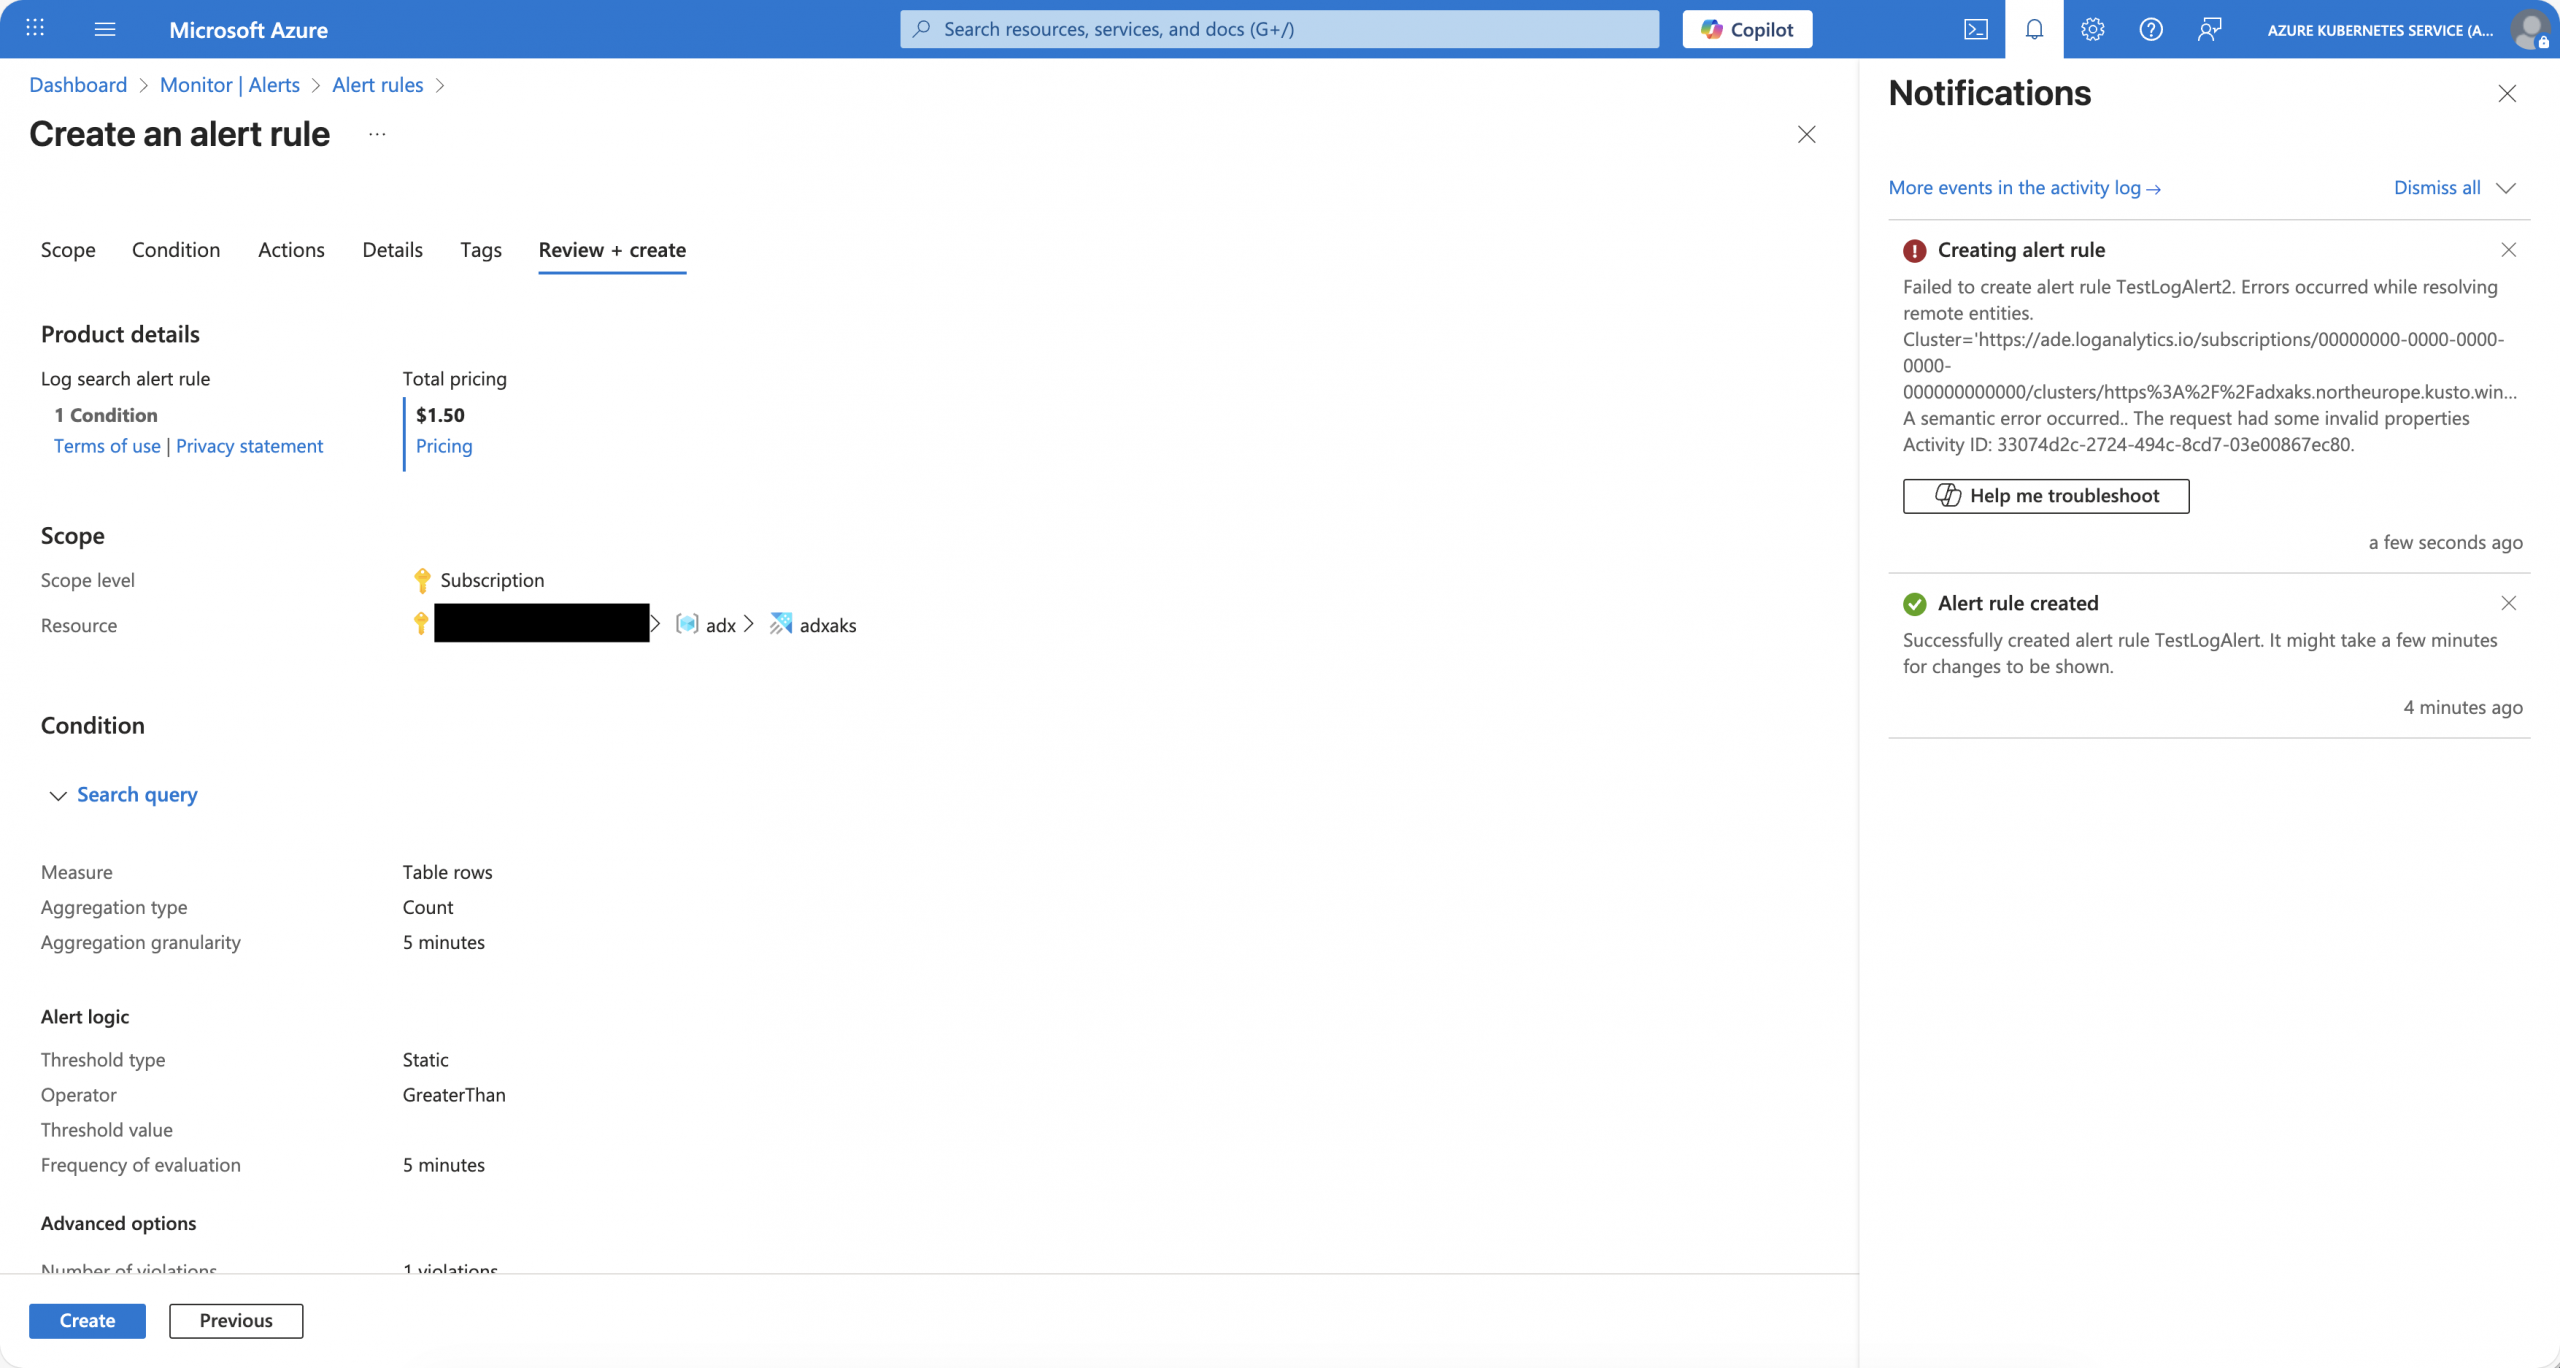
Whatever you choose, one of them is required. Otherwise, you get an error message when you try to create the log alert.
Log alert
To create a log alert that targets our Azure Data Explorer cluster, we follow the Azure documentation for it.
-> https://learn.microsoft.com/en-us/azure/azure-monitor/alerts/alerts-create-log-alert-rule
-> https://techcommunity.microsoft.com/blog/azuredataexplorer/monitor-your-data-using-azure-monitor-log-search-alerts-and-the-azure-data-explo/4113837
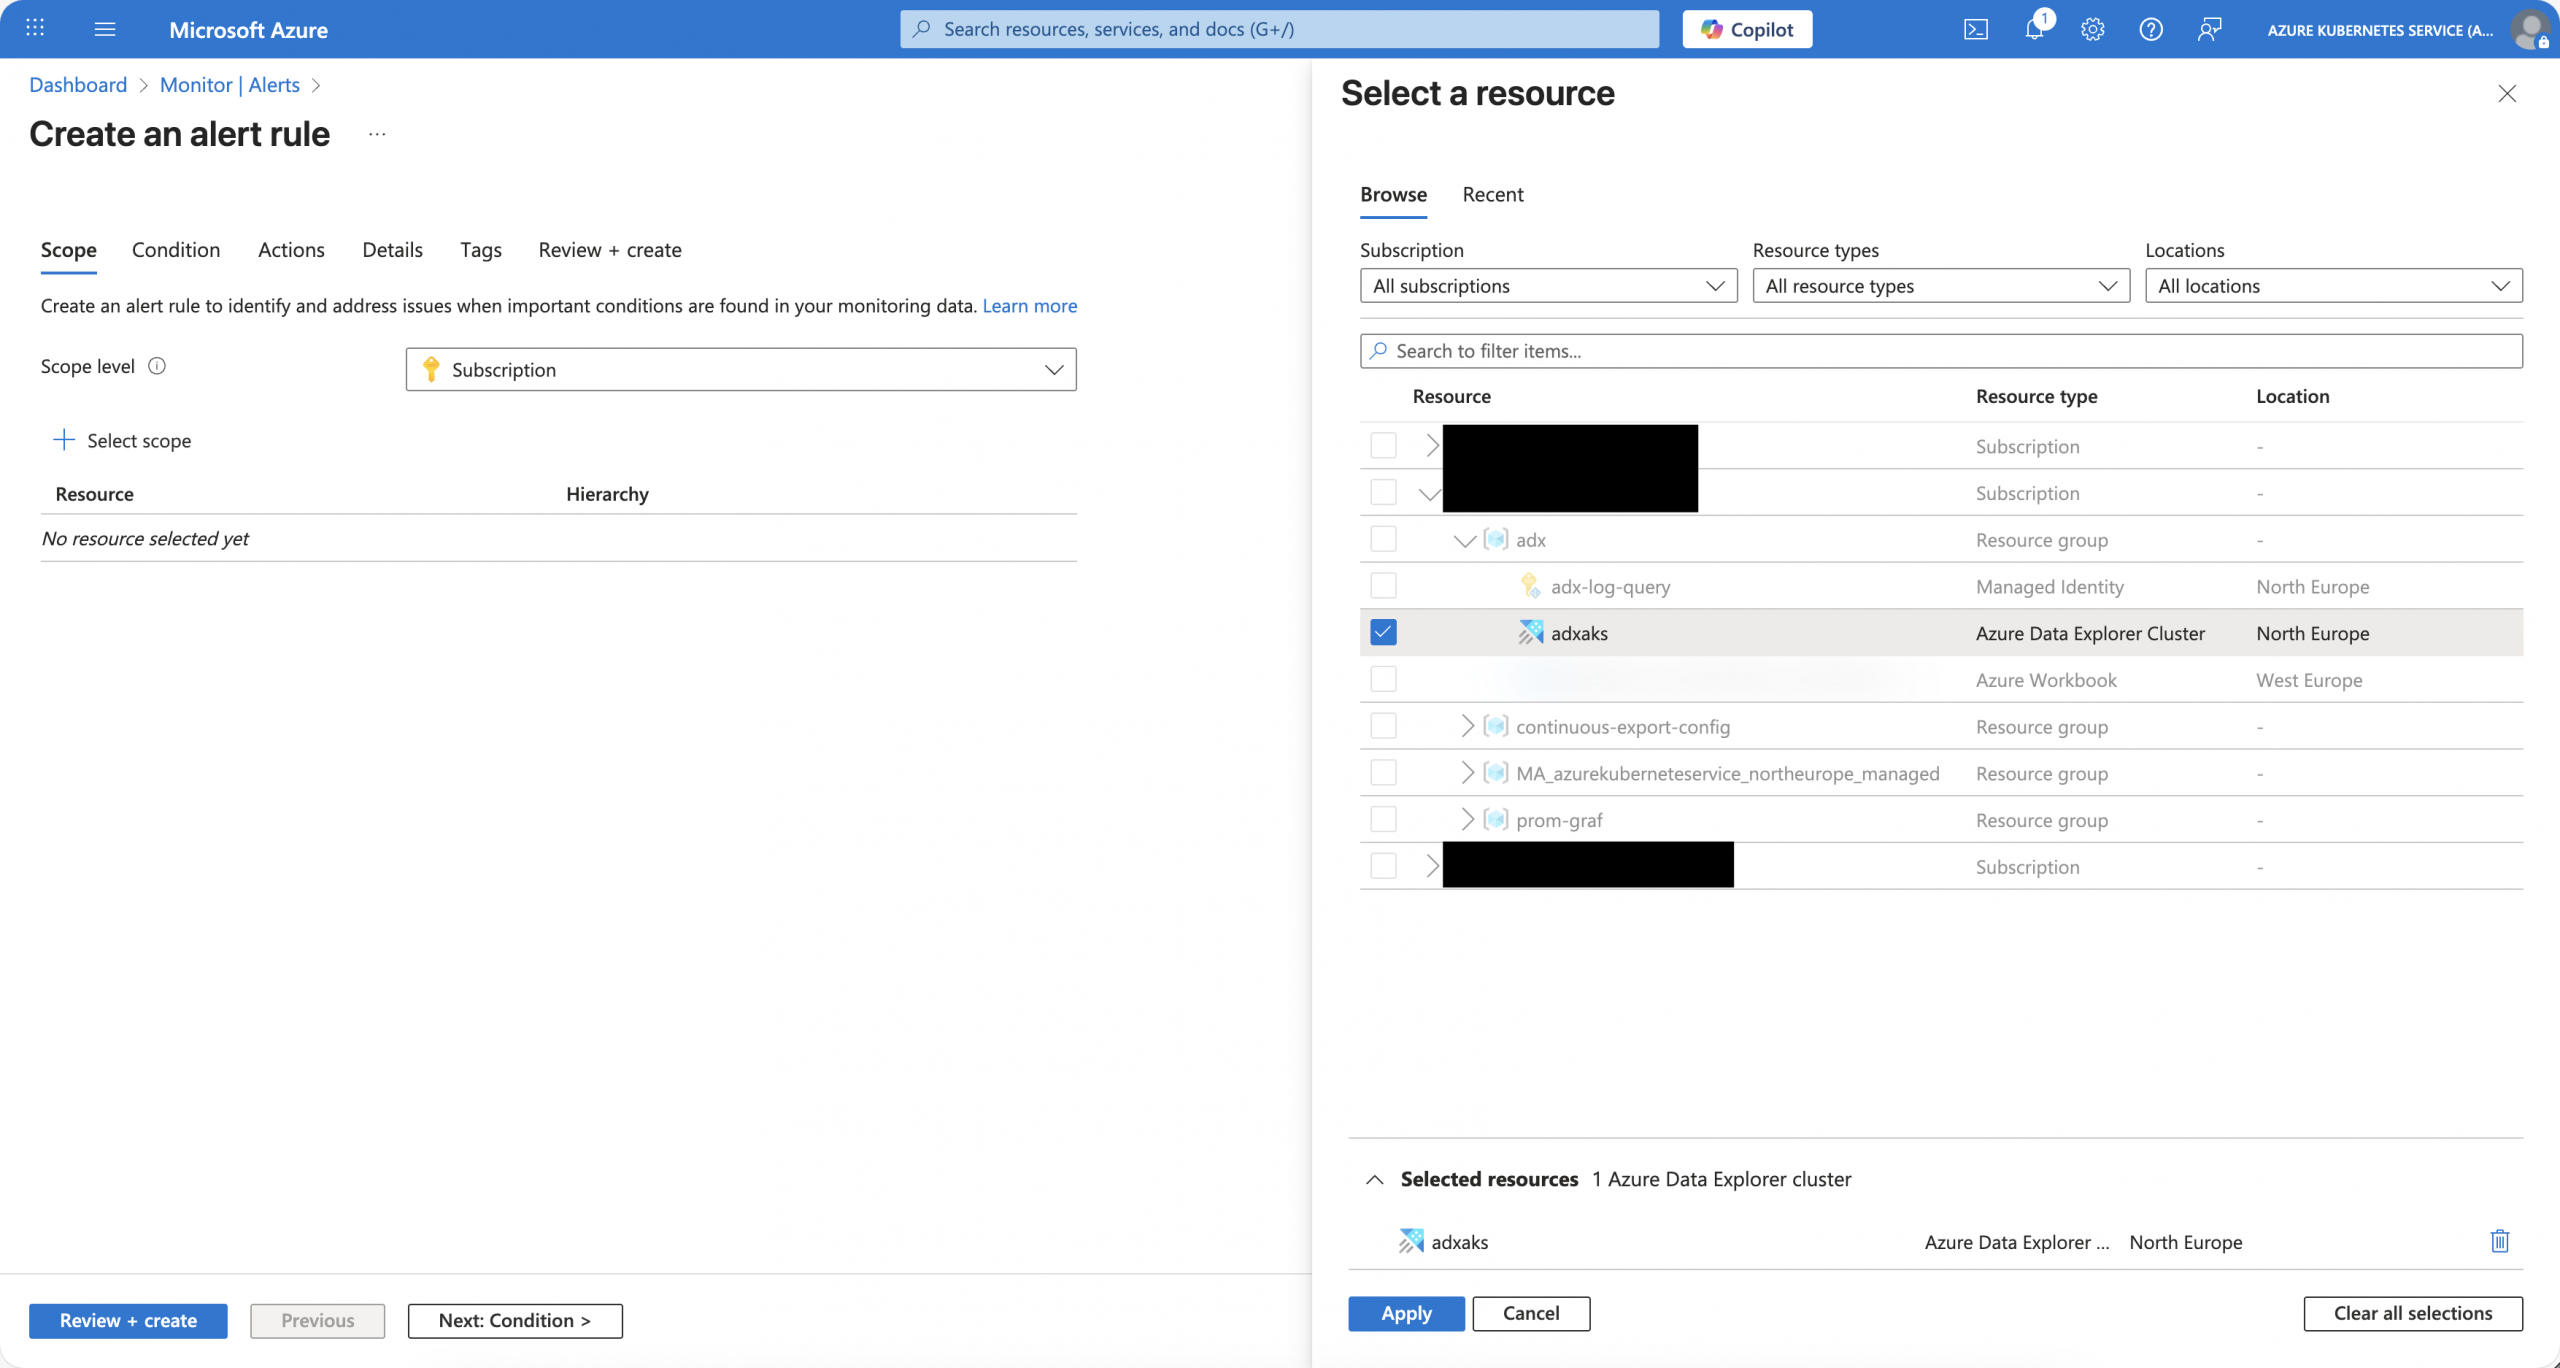
One of the important parts is to select the Azure Data Explorer directly in the Scope section, as seen in the screenshot below.
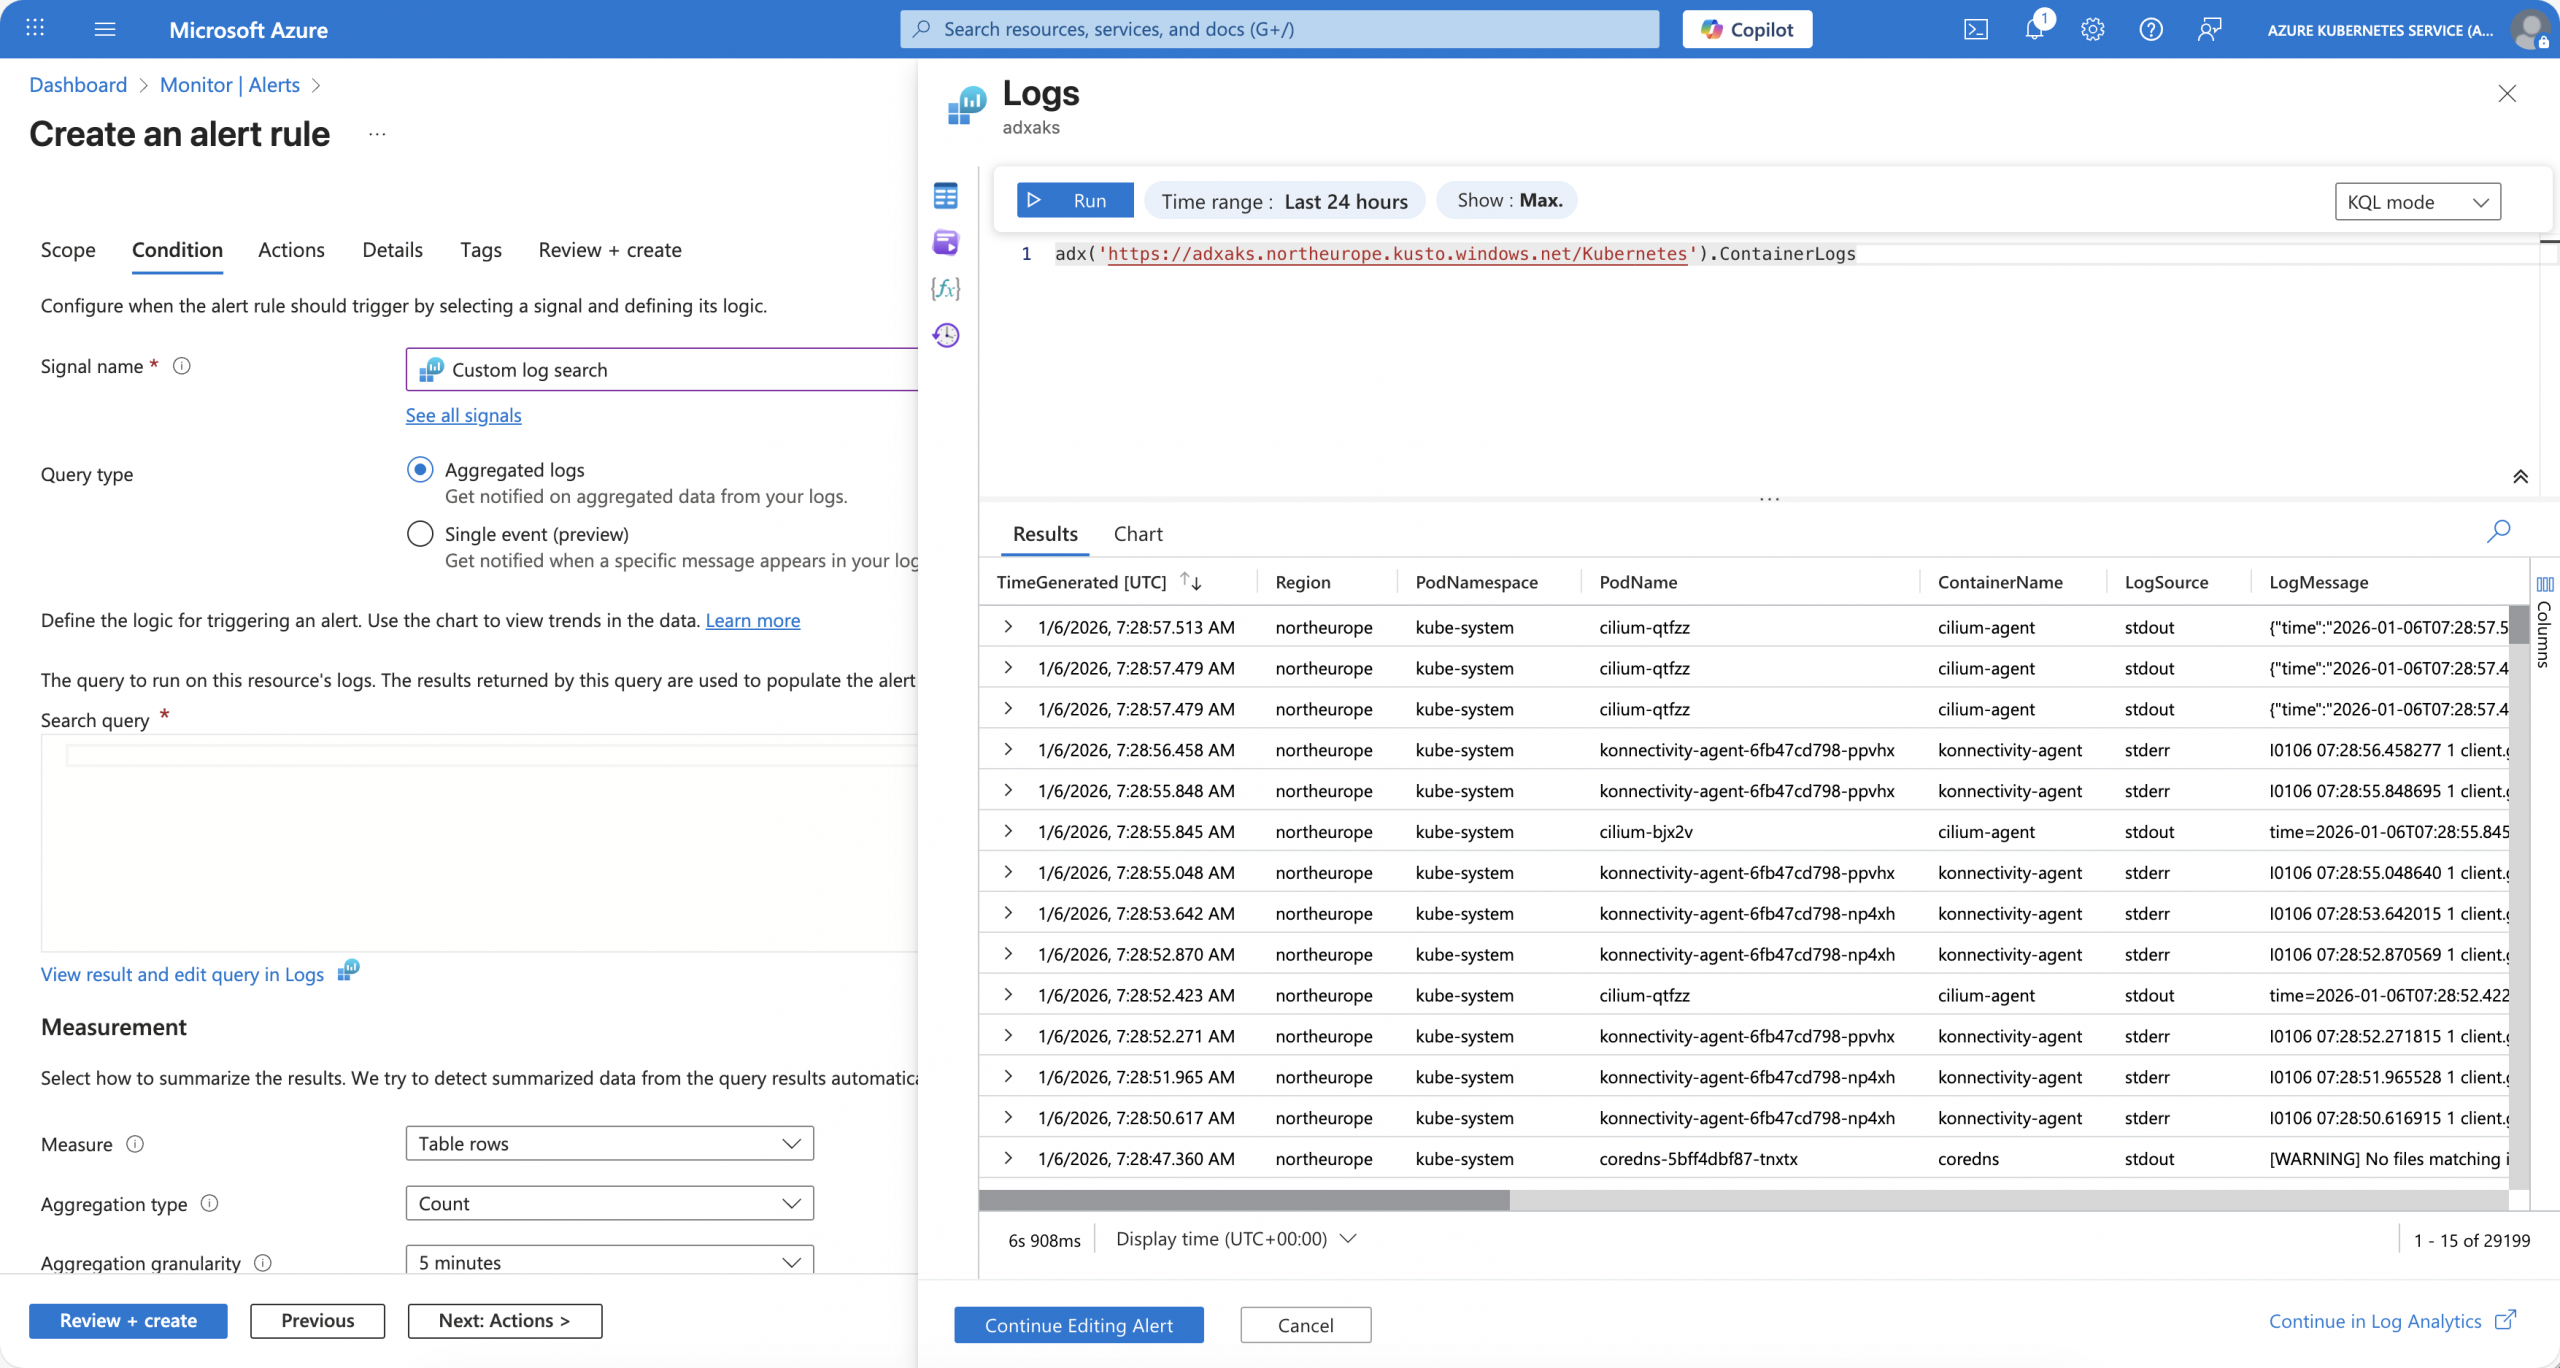
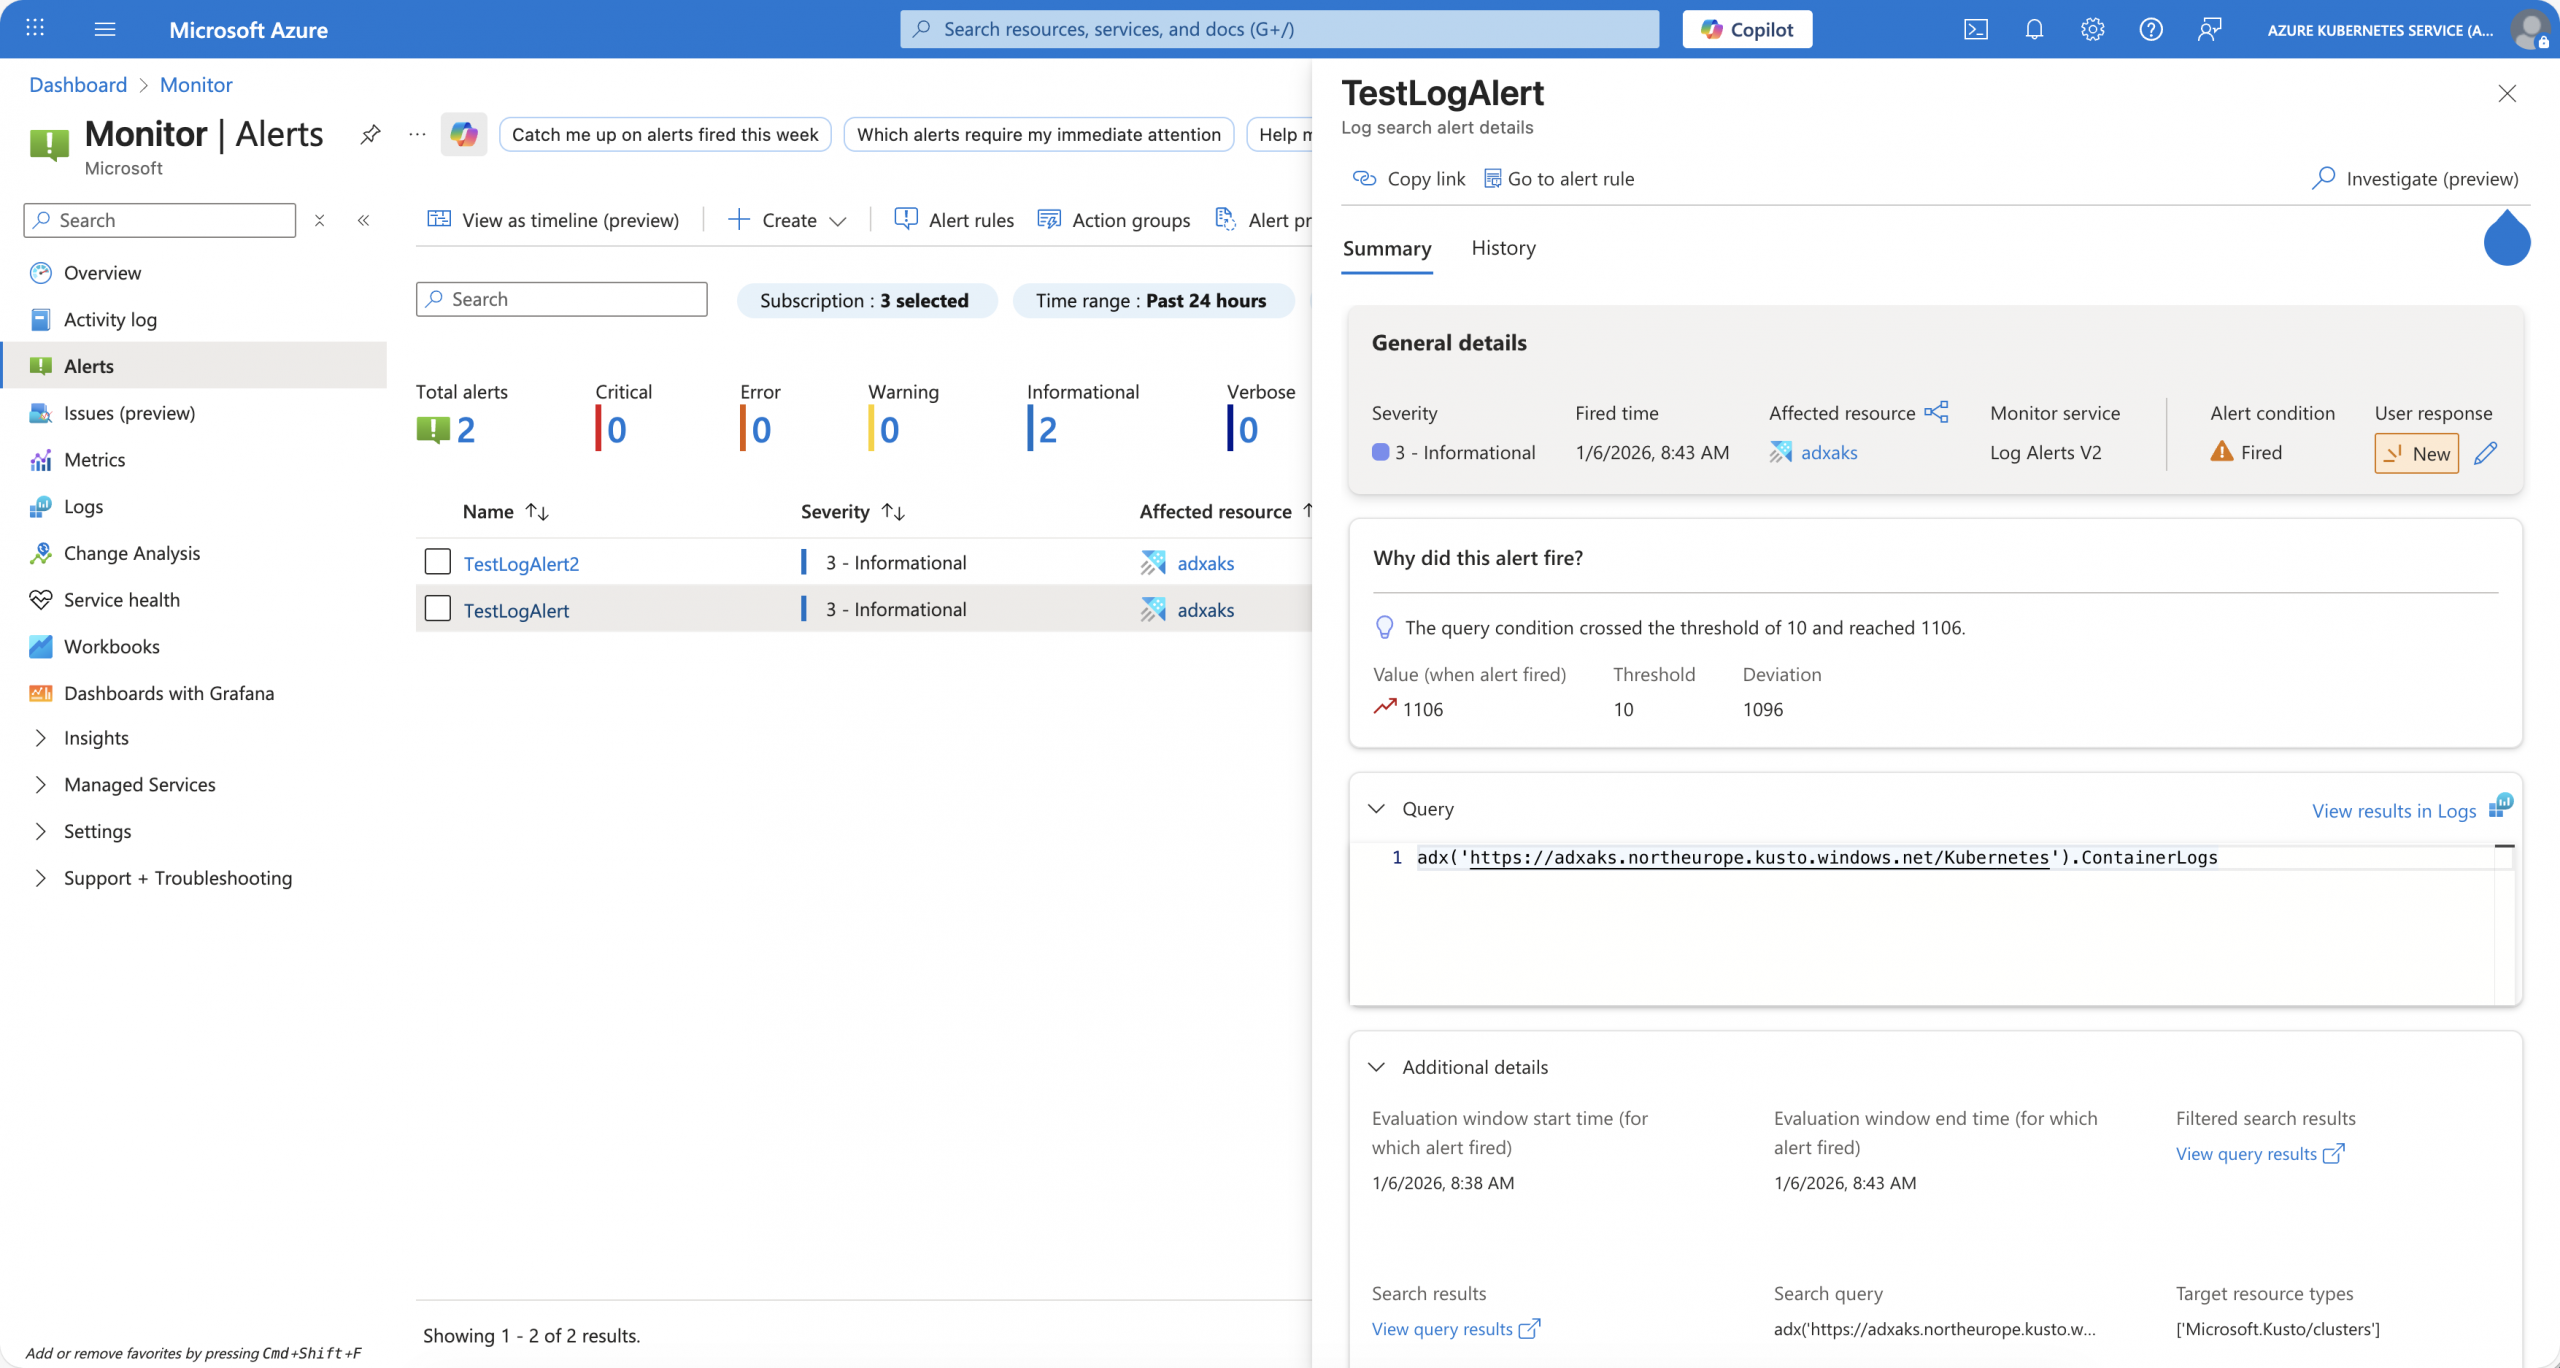
Under the Condition section, we select “Custom log search” as the signal. We then hit “View result and edit query in Logs” if the query editor does not open automatically. To target the Azure Data Explorer cluster, we use the adx() function.
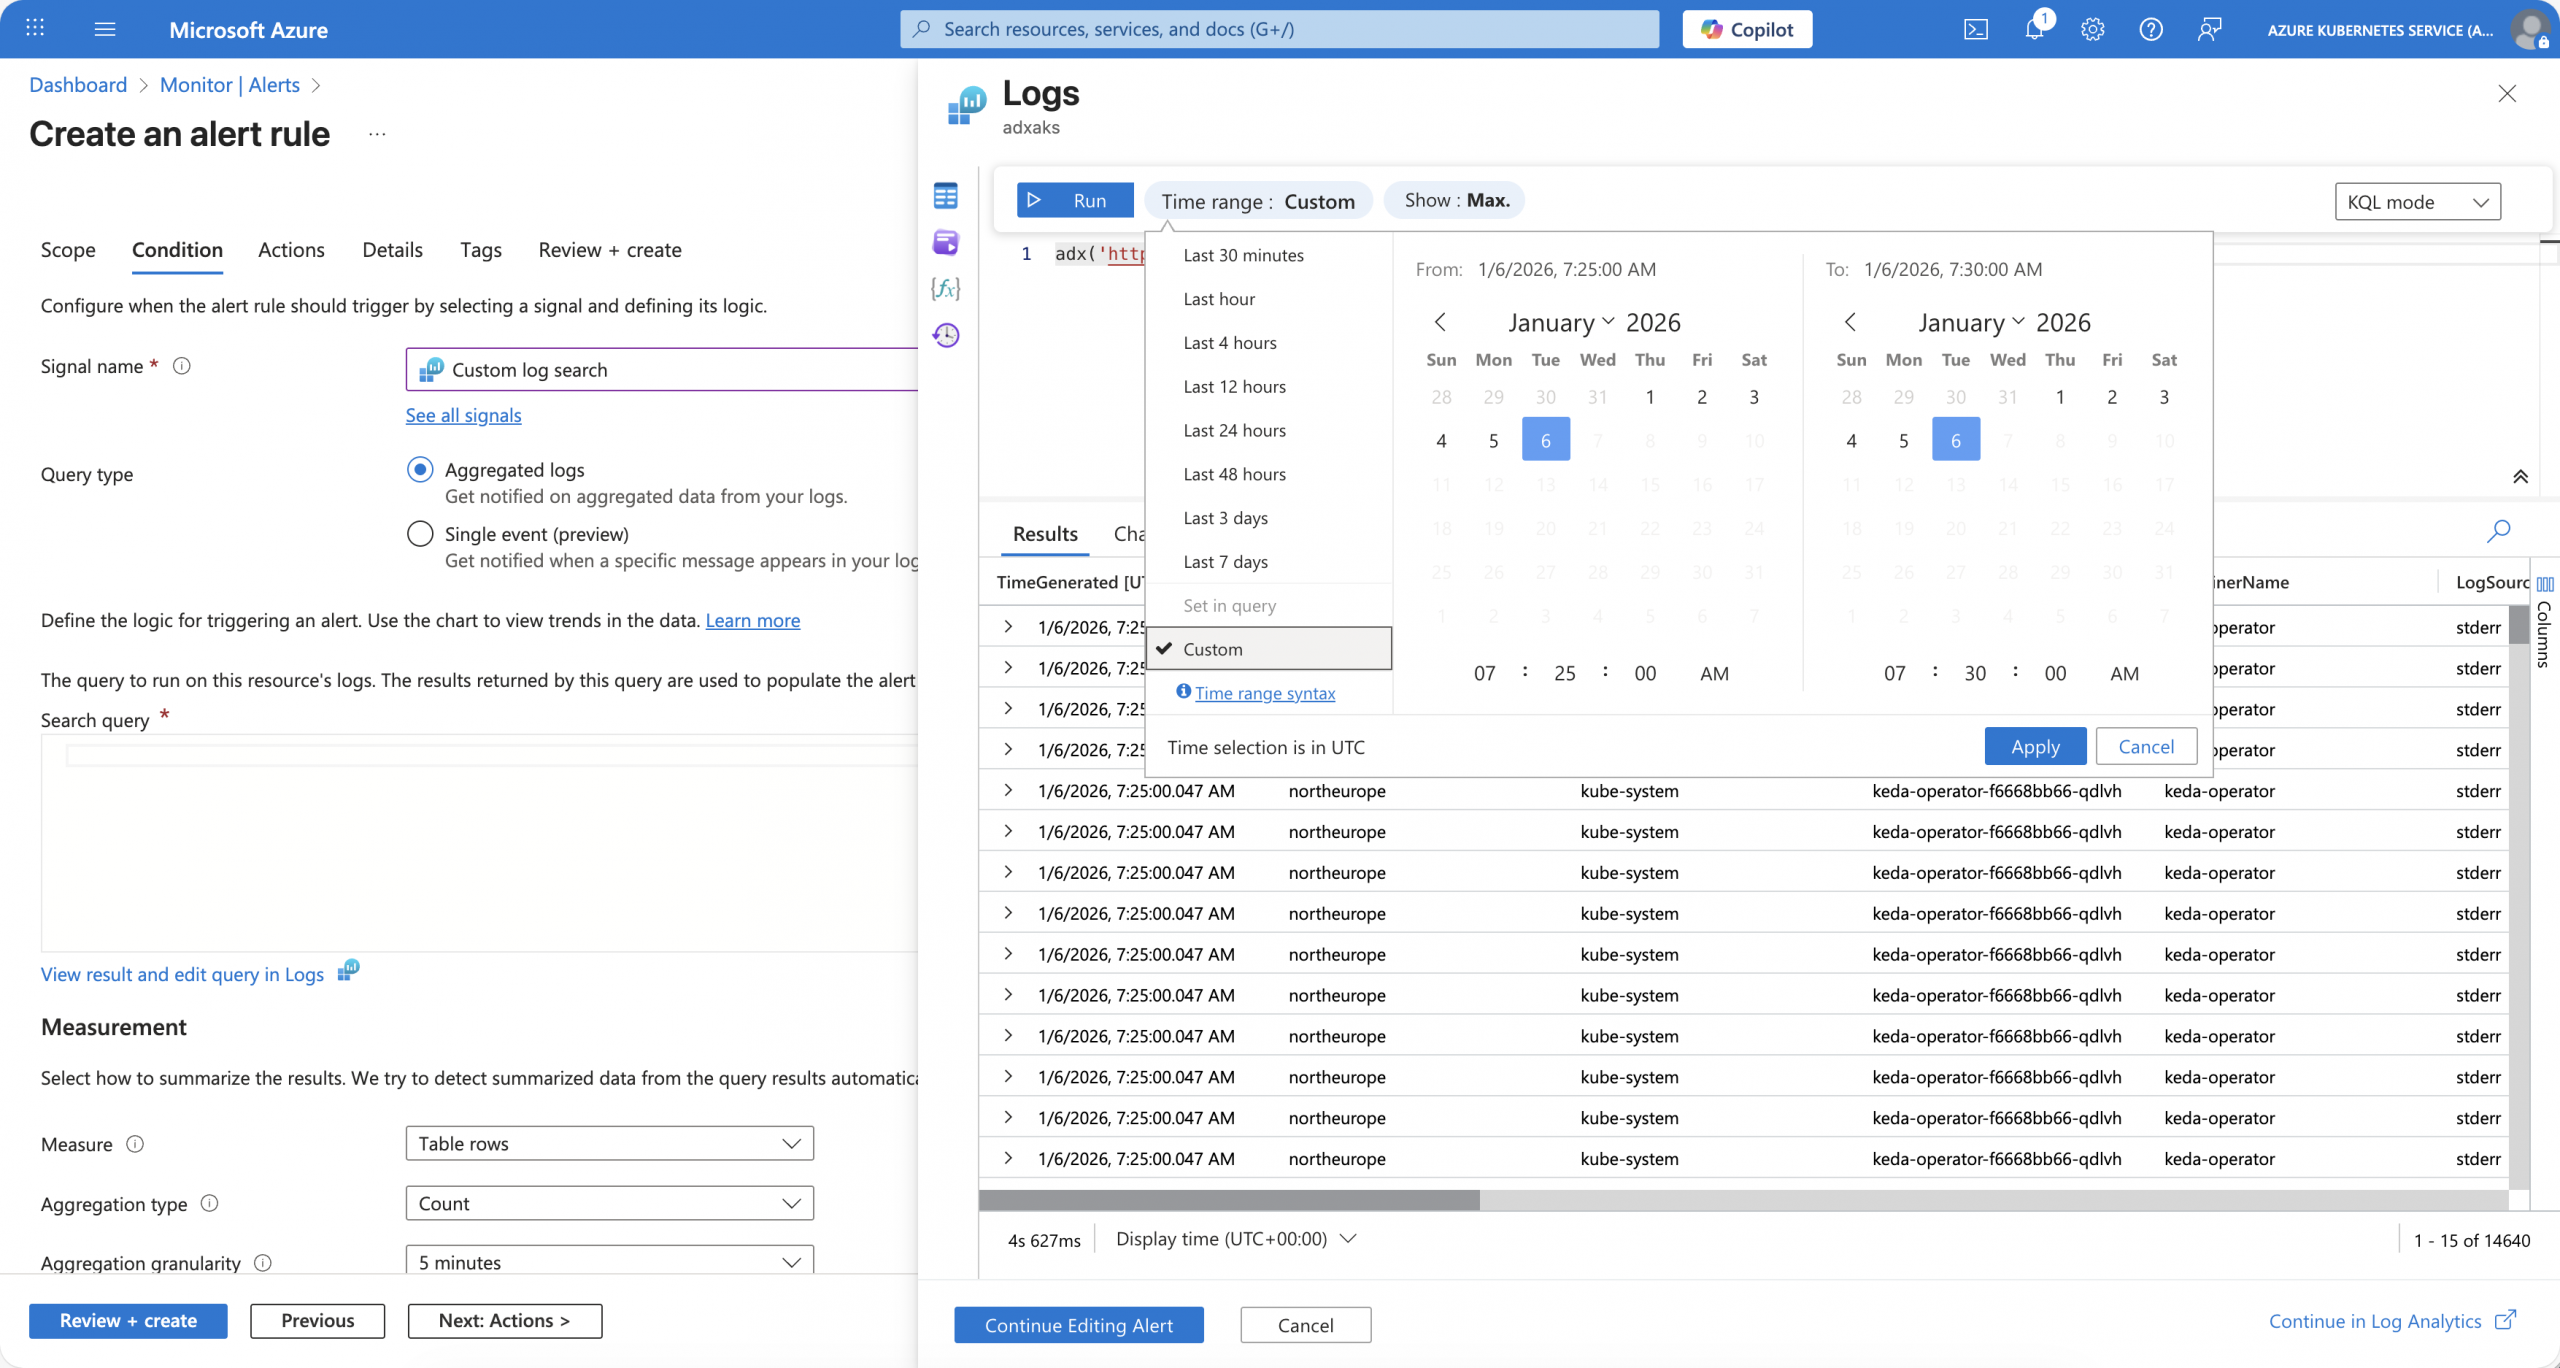
Here comes the hidden gem into play. The time range selector in the query editor, as well as the aggregation granularity of the log alert, is bound to a column called TimeGenerated to apply the time range selection to.
So, if you designed your tables in Azure Data Explorer the right way, storing timestamp data in a column TimeGenerated, then you can write log alert queries as you are used to with Azure Log Analytics.
In the following screenshots, I use a time range of 24 hours, returning 29199 log entries, and then a custom 5-minute time range returning 14640 log entries.
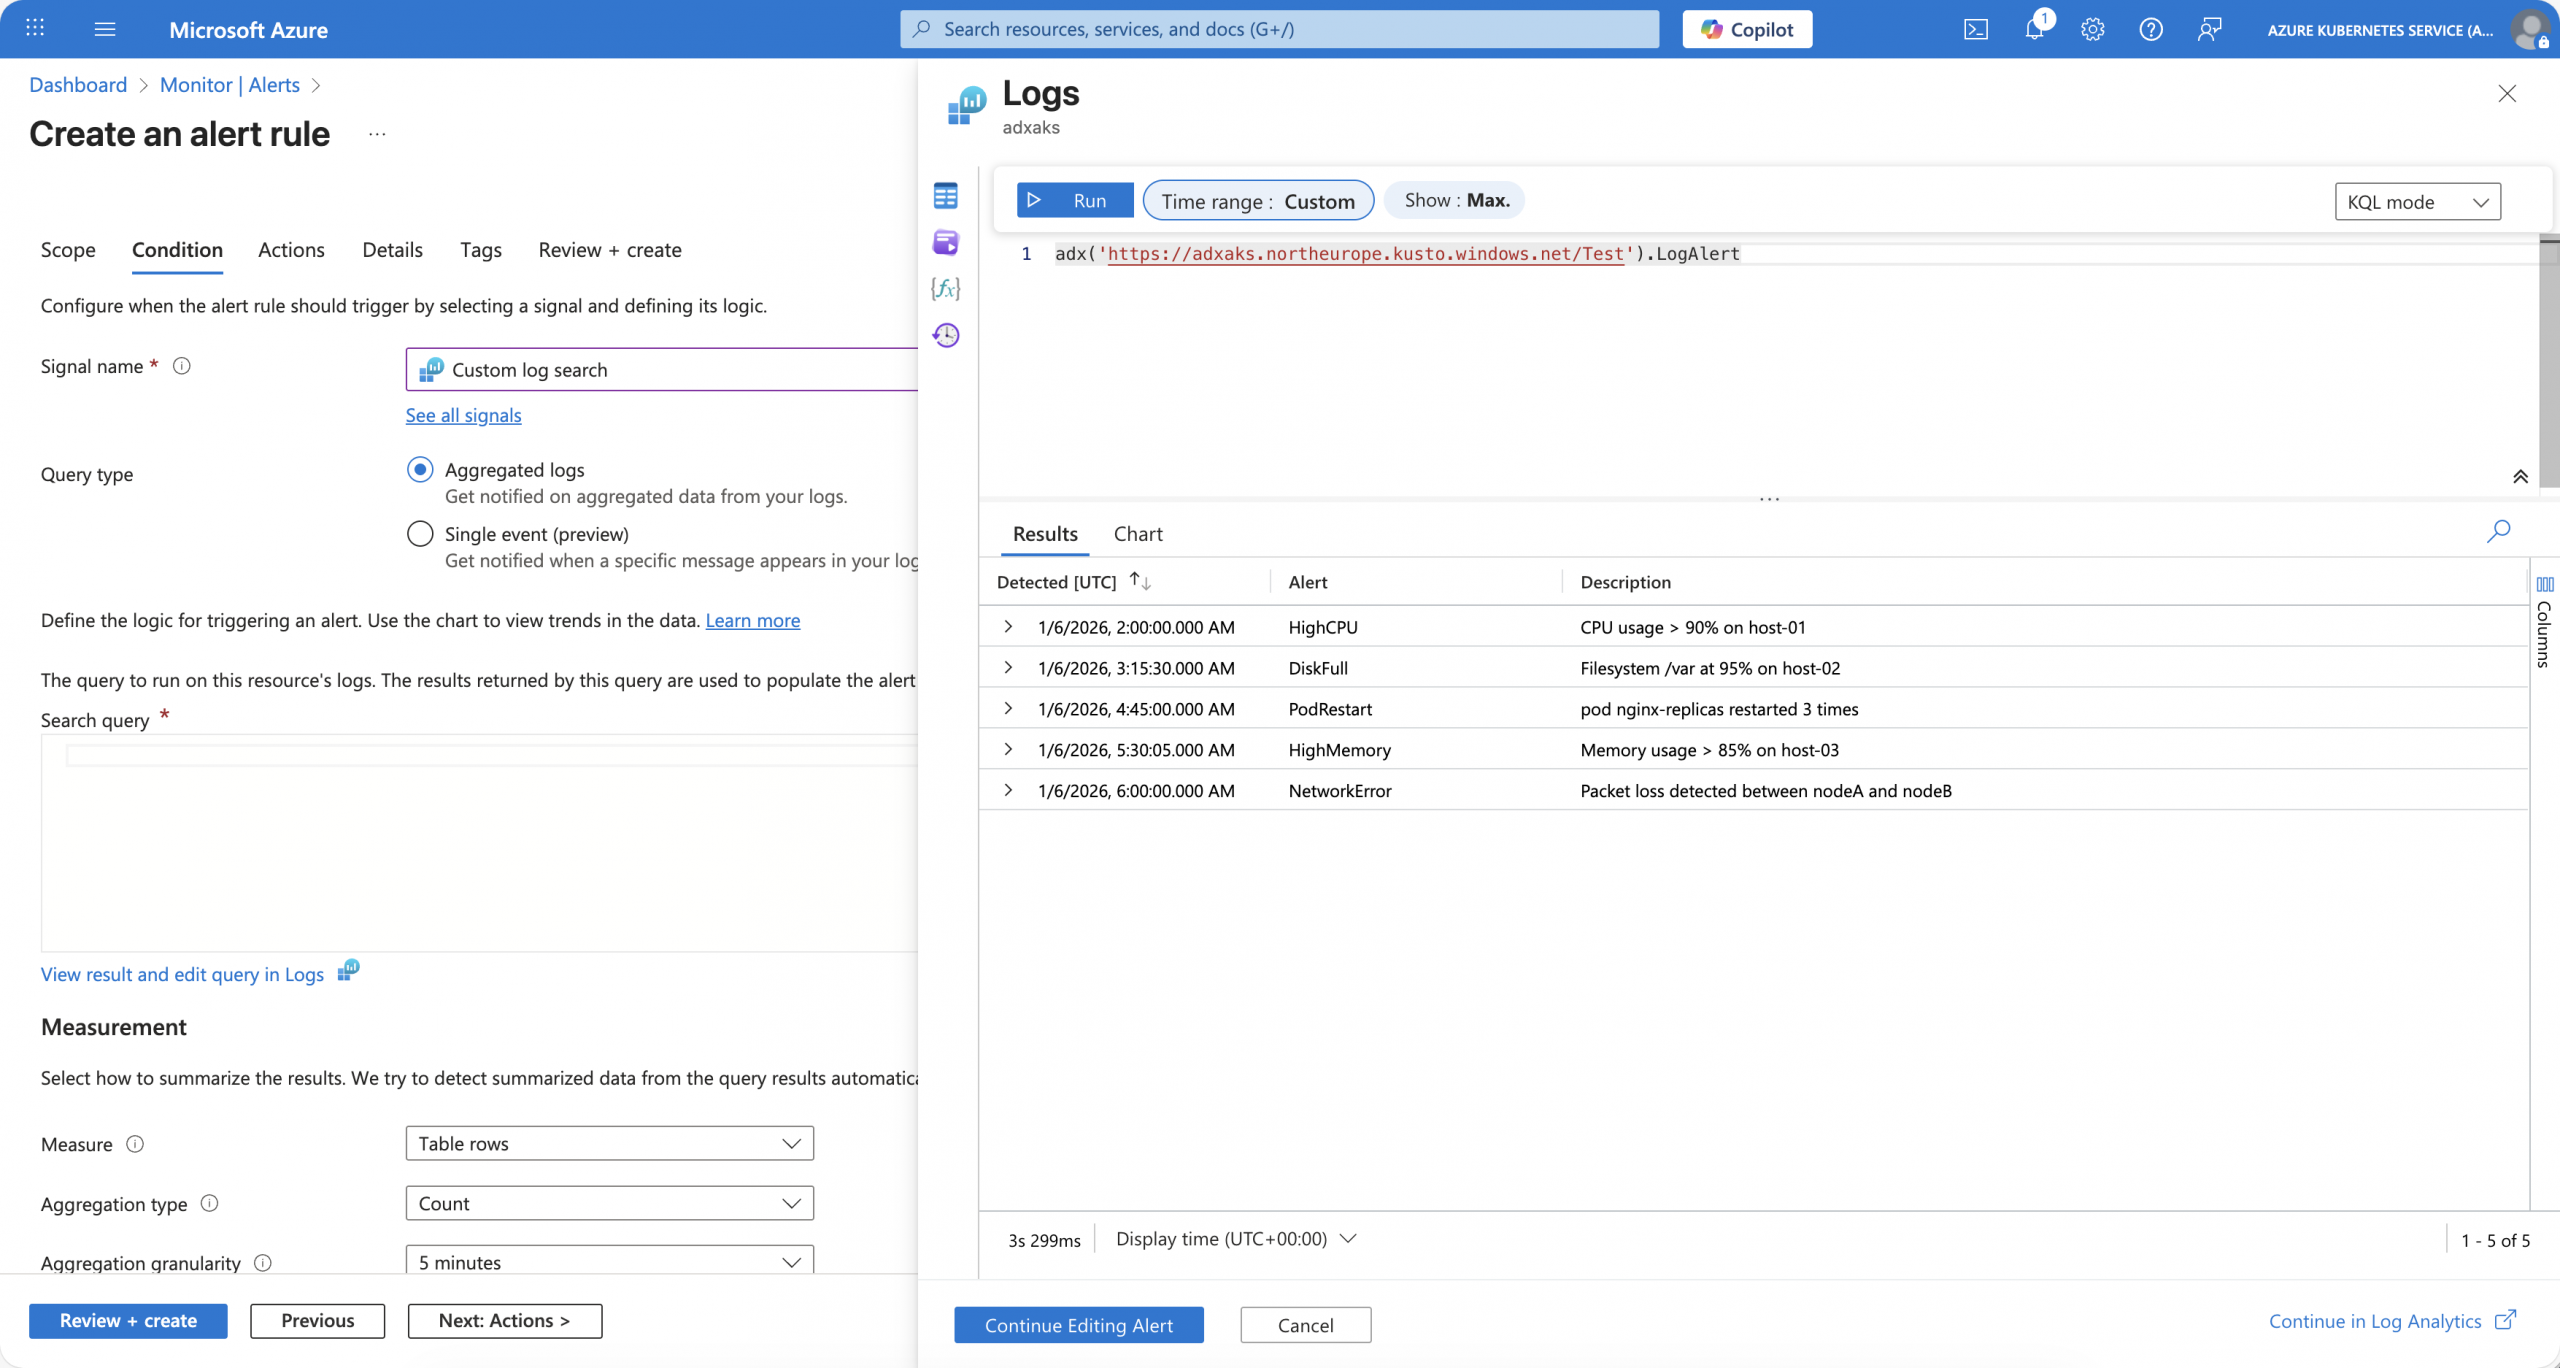
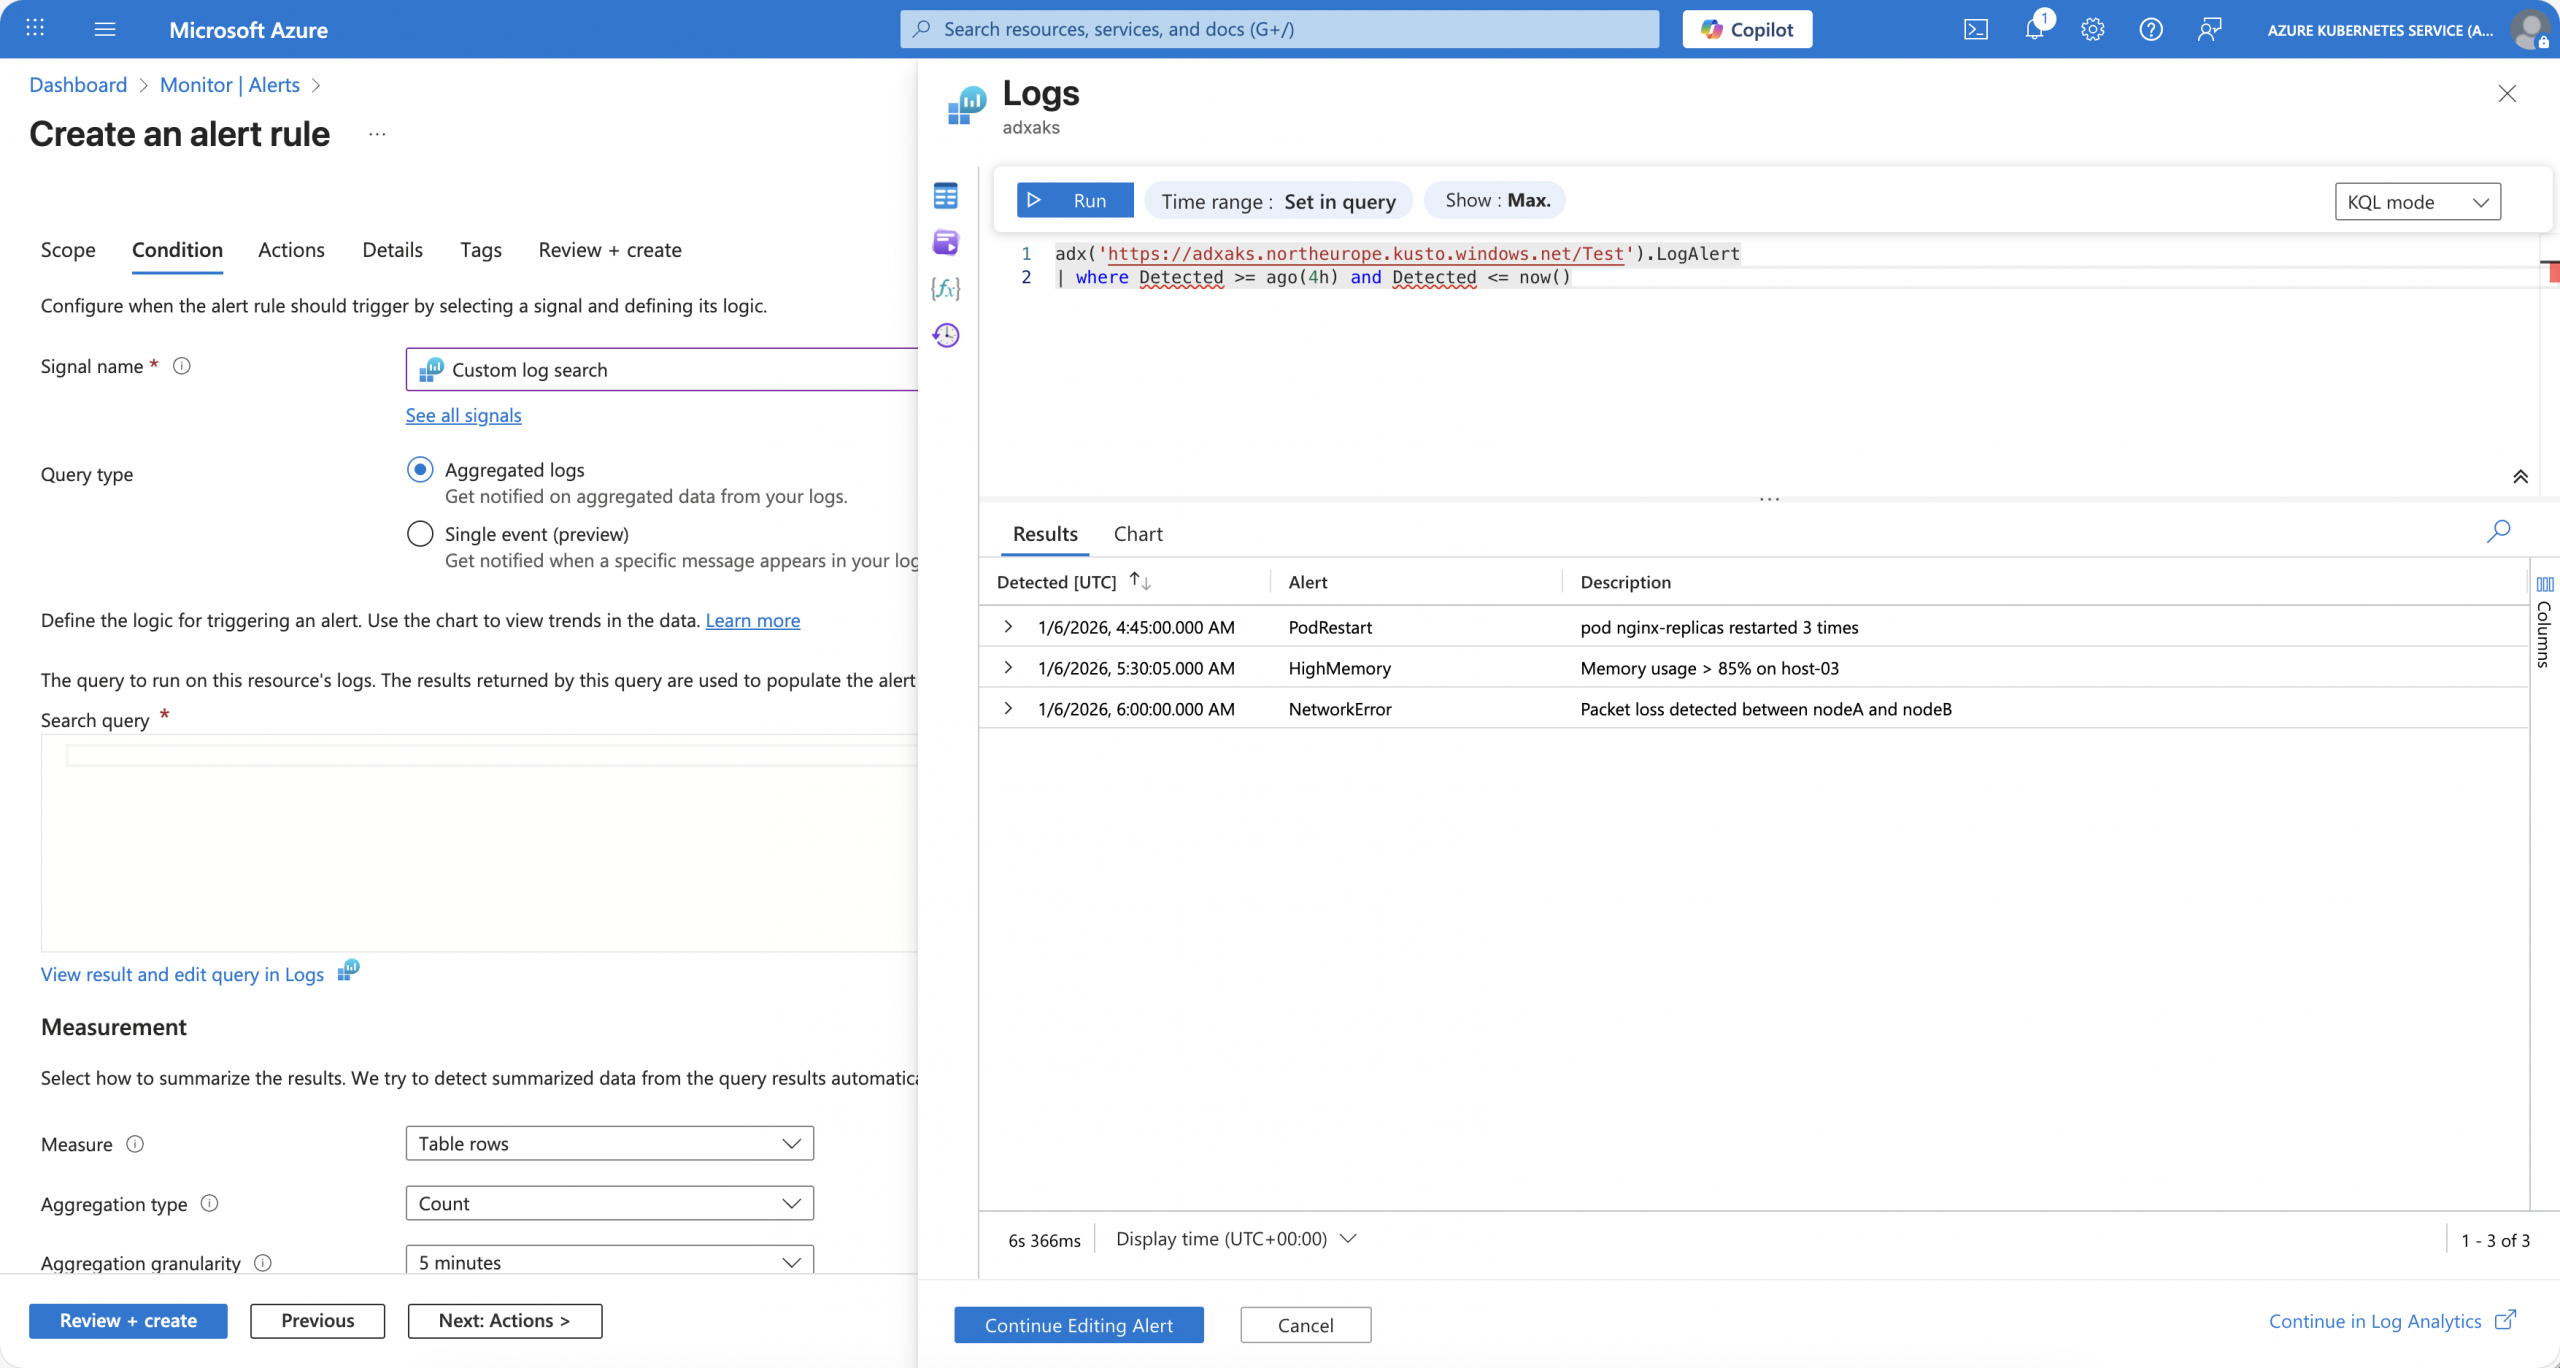
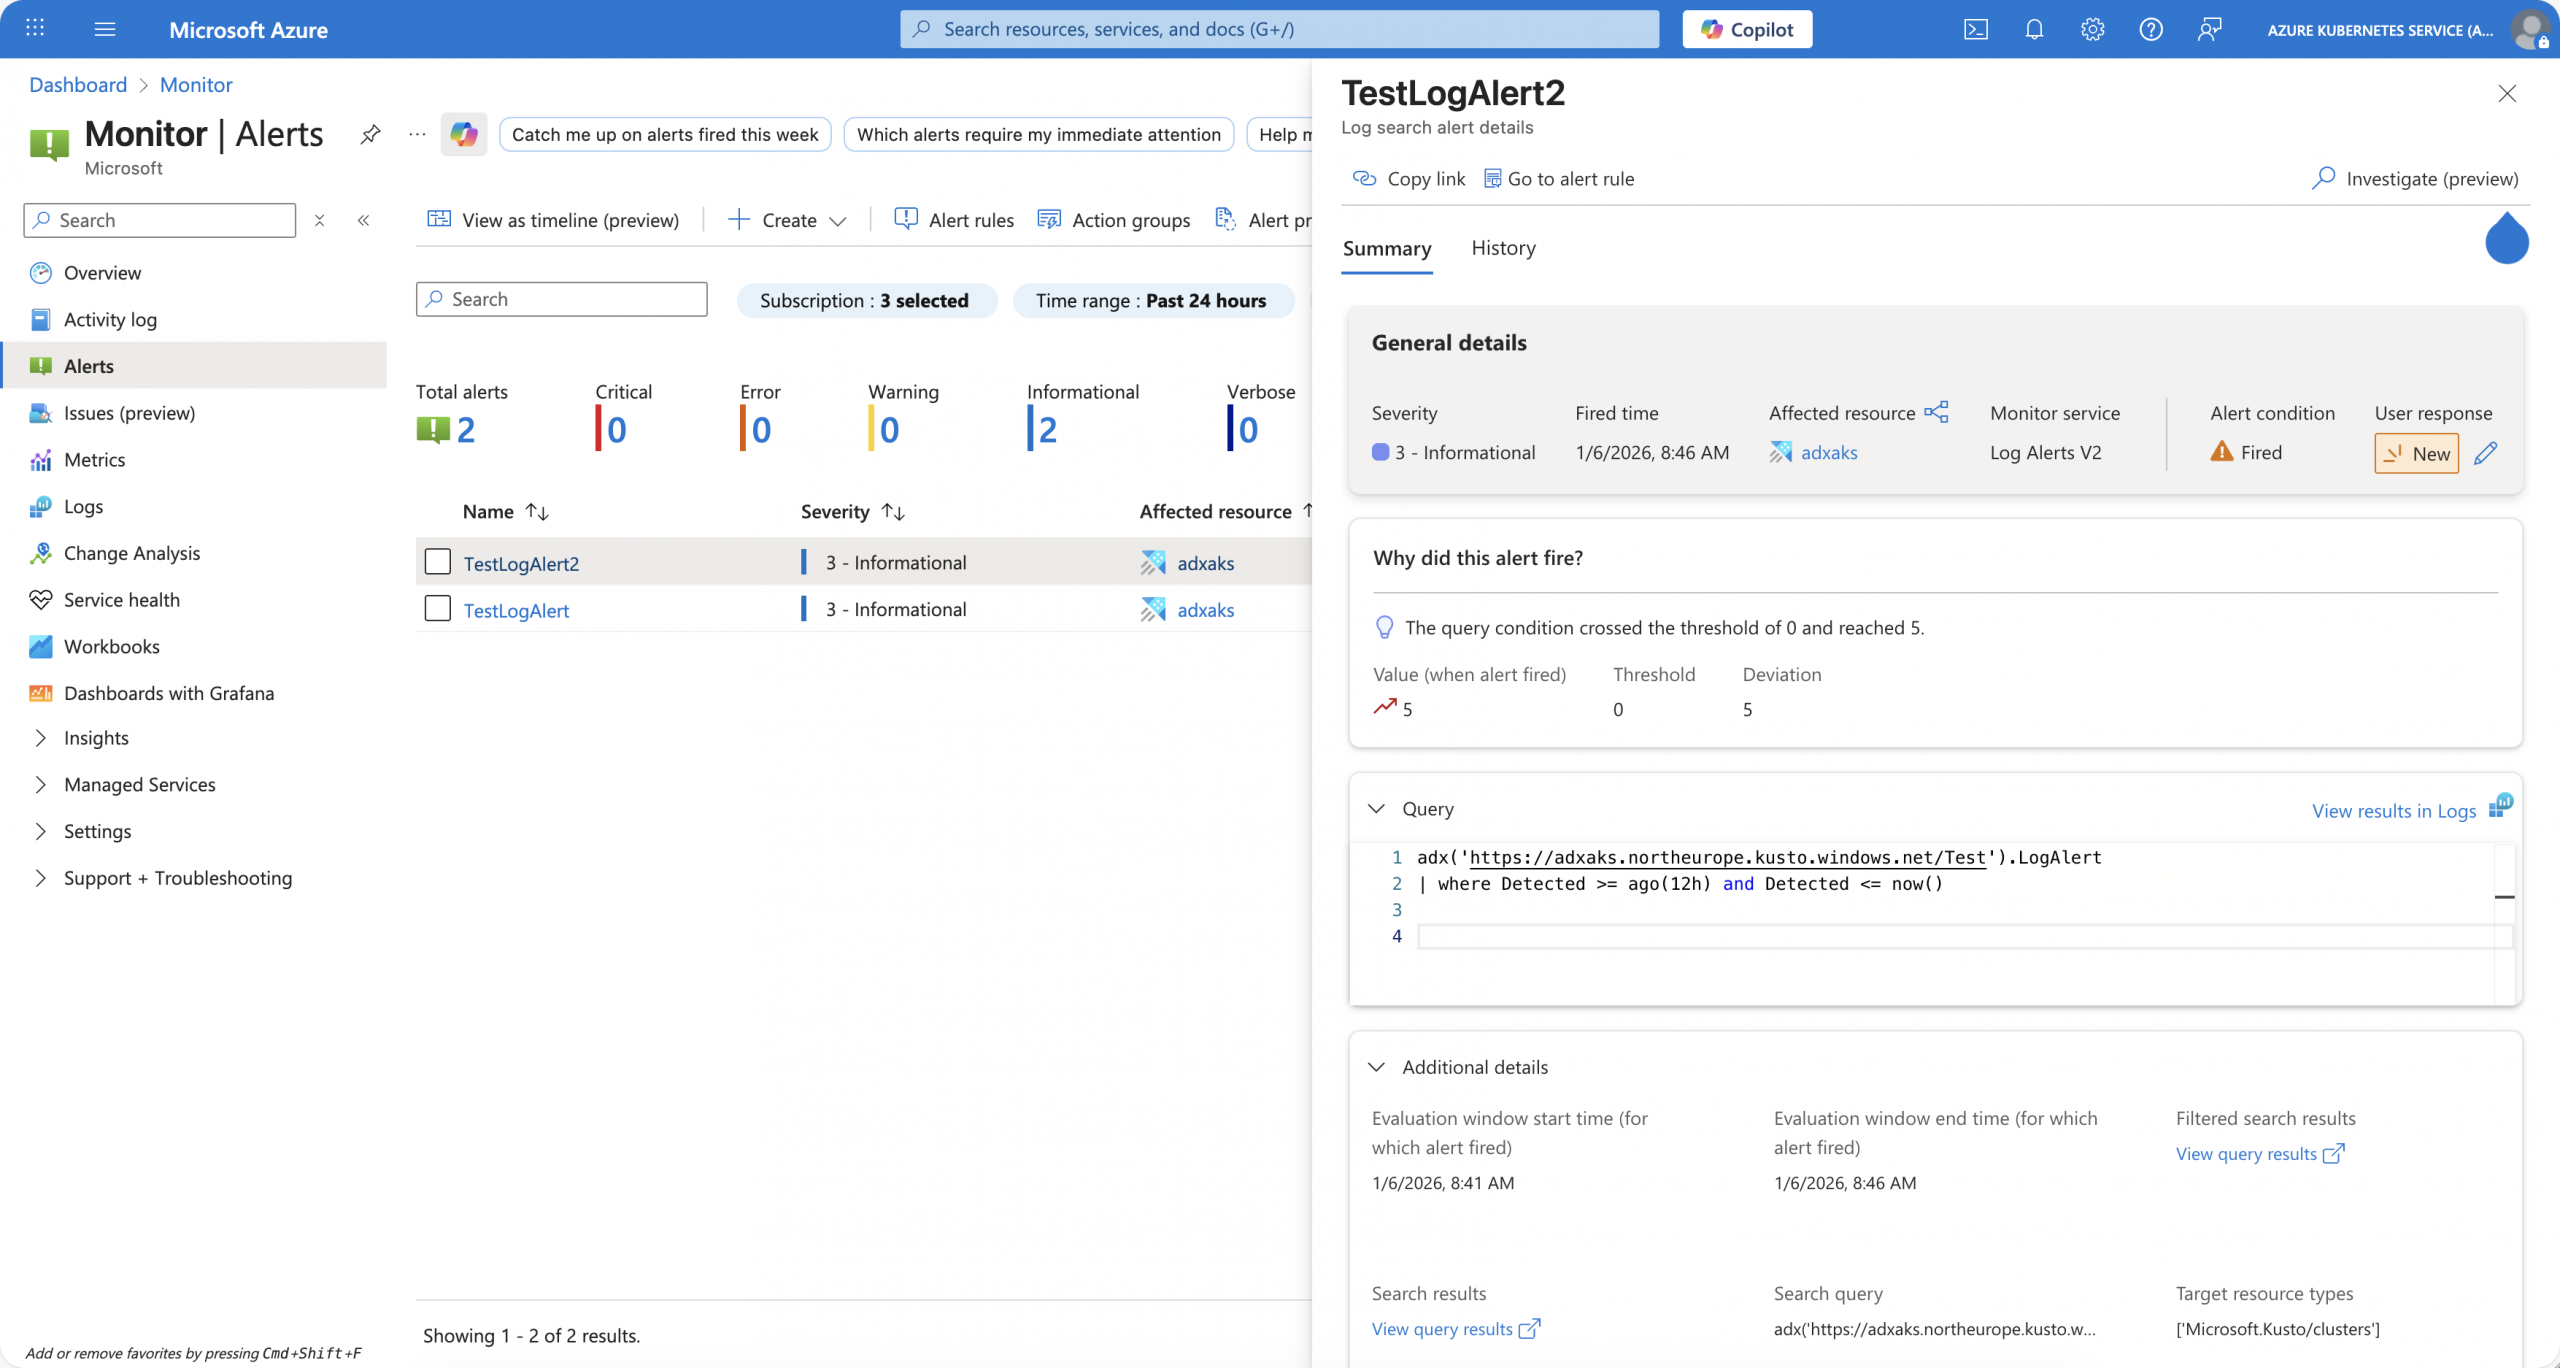
When you store your timestamp data in a column named differently from TimeGenerated, then you must specify the time range for the log alert within the query.
The following screenshots show a second log alert configuration with the same custom 5-minute time range. However, the first query returns all log entries from the table as the time range filter cannot be applied. Once we specify the time range within the query by using the column containing the timestamps, we get a filtered result set.
Last but not least, we use our pre-created user-assigned managed identity for the log alerts.
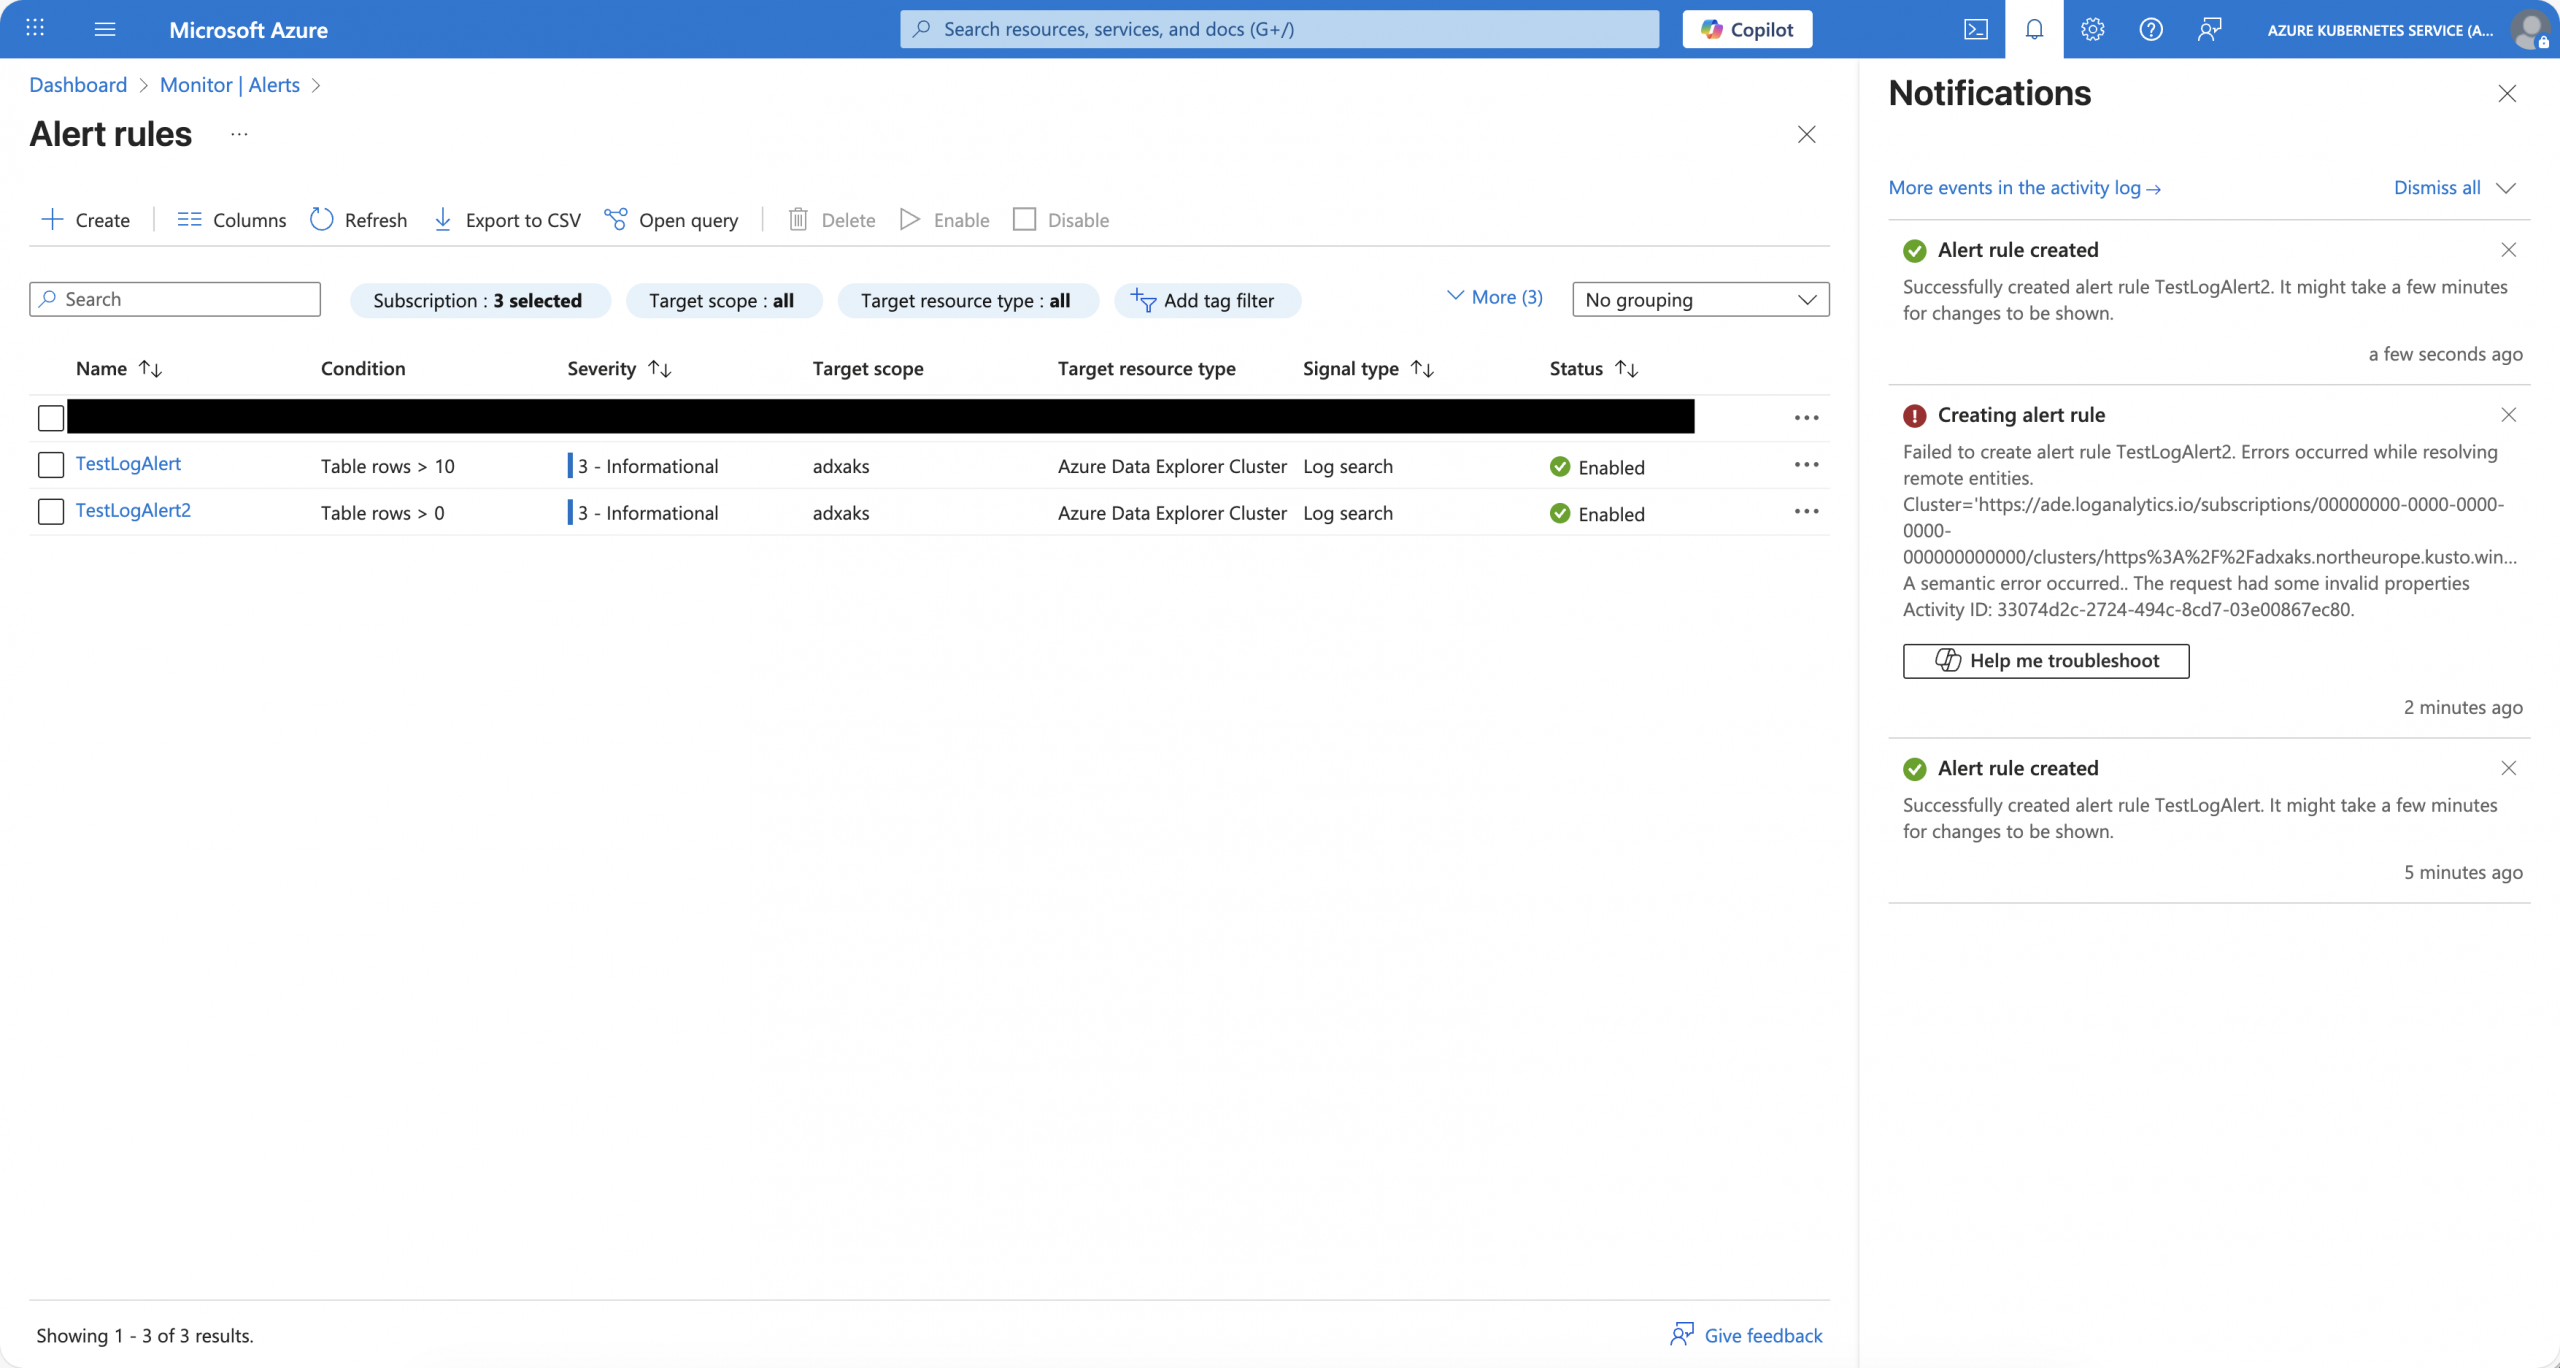
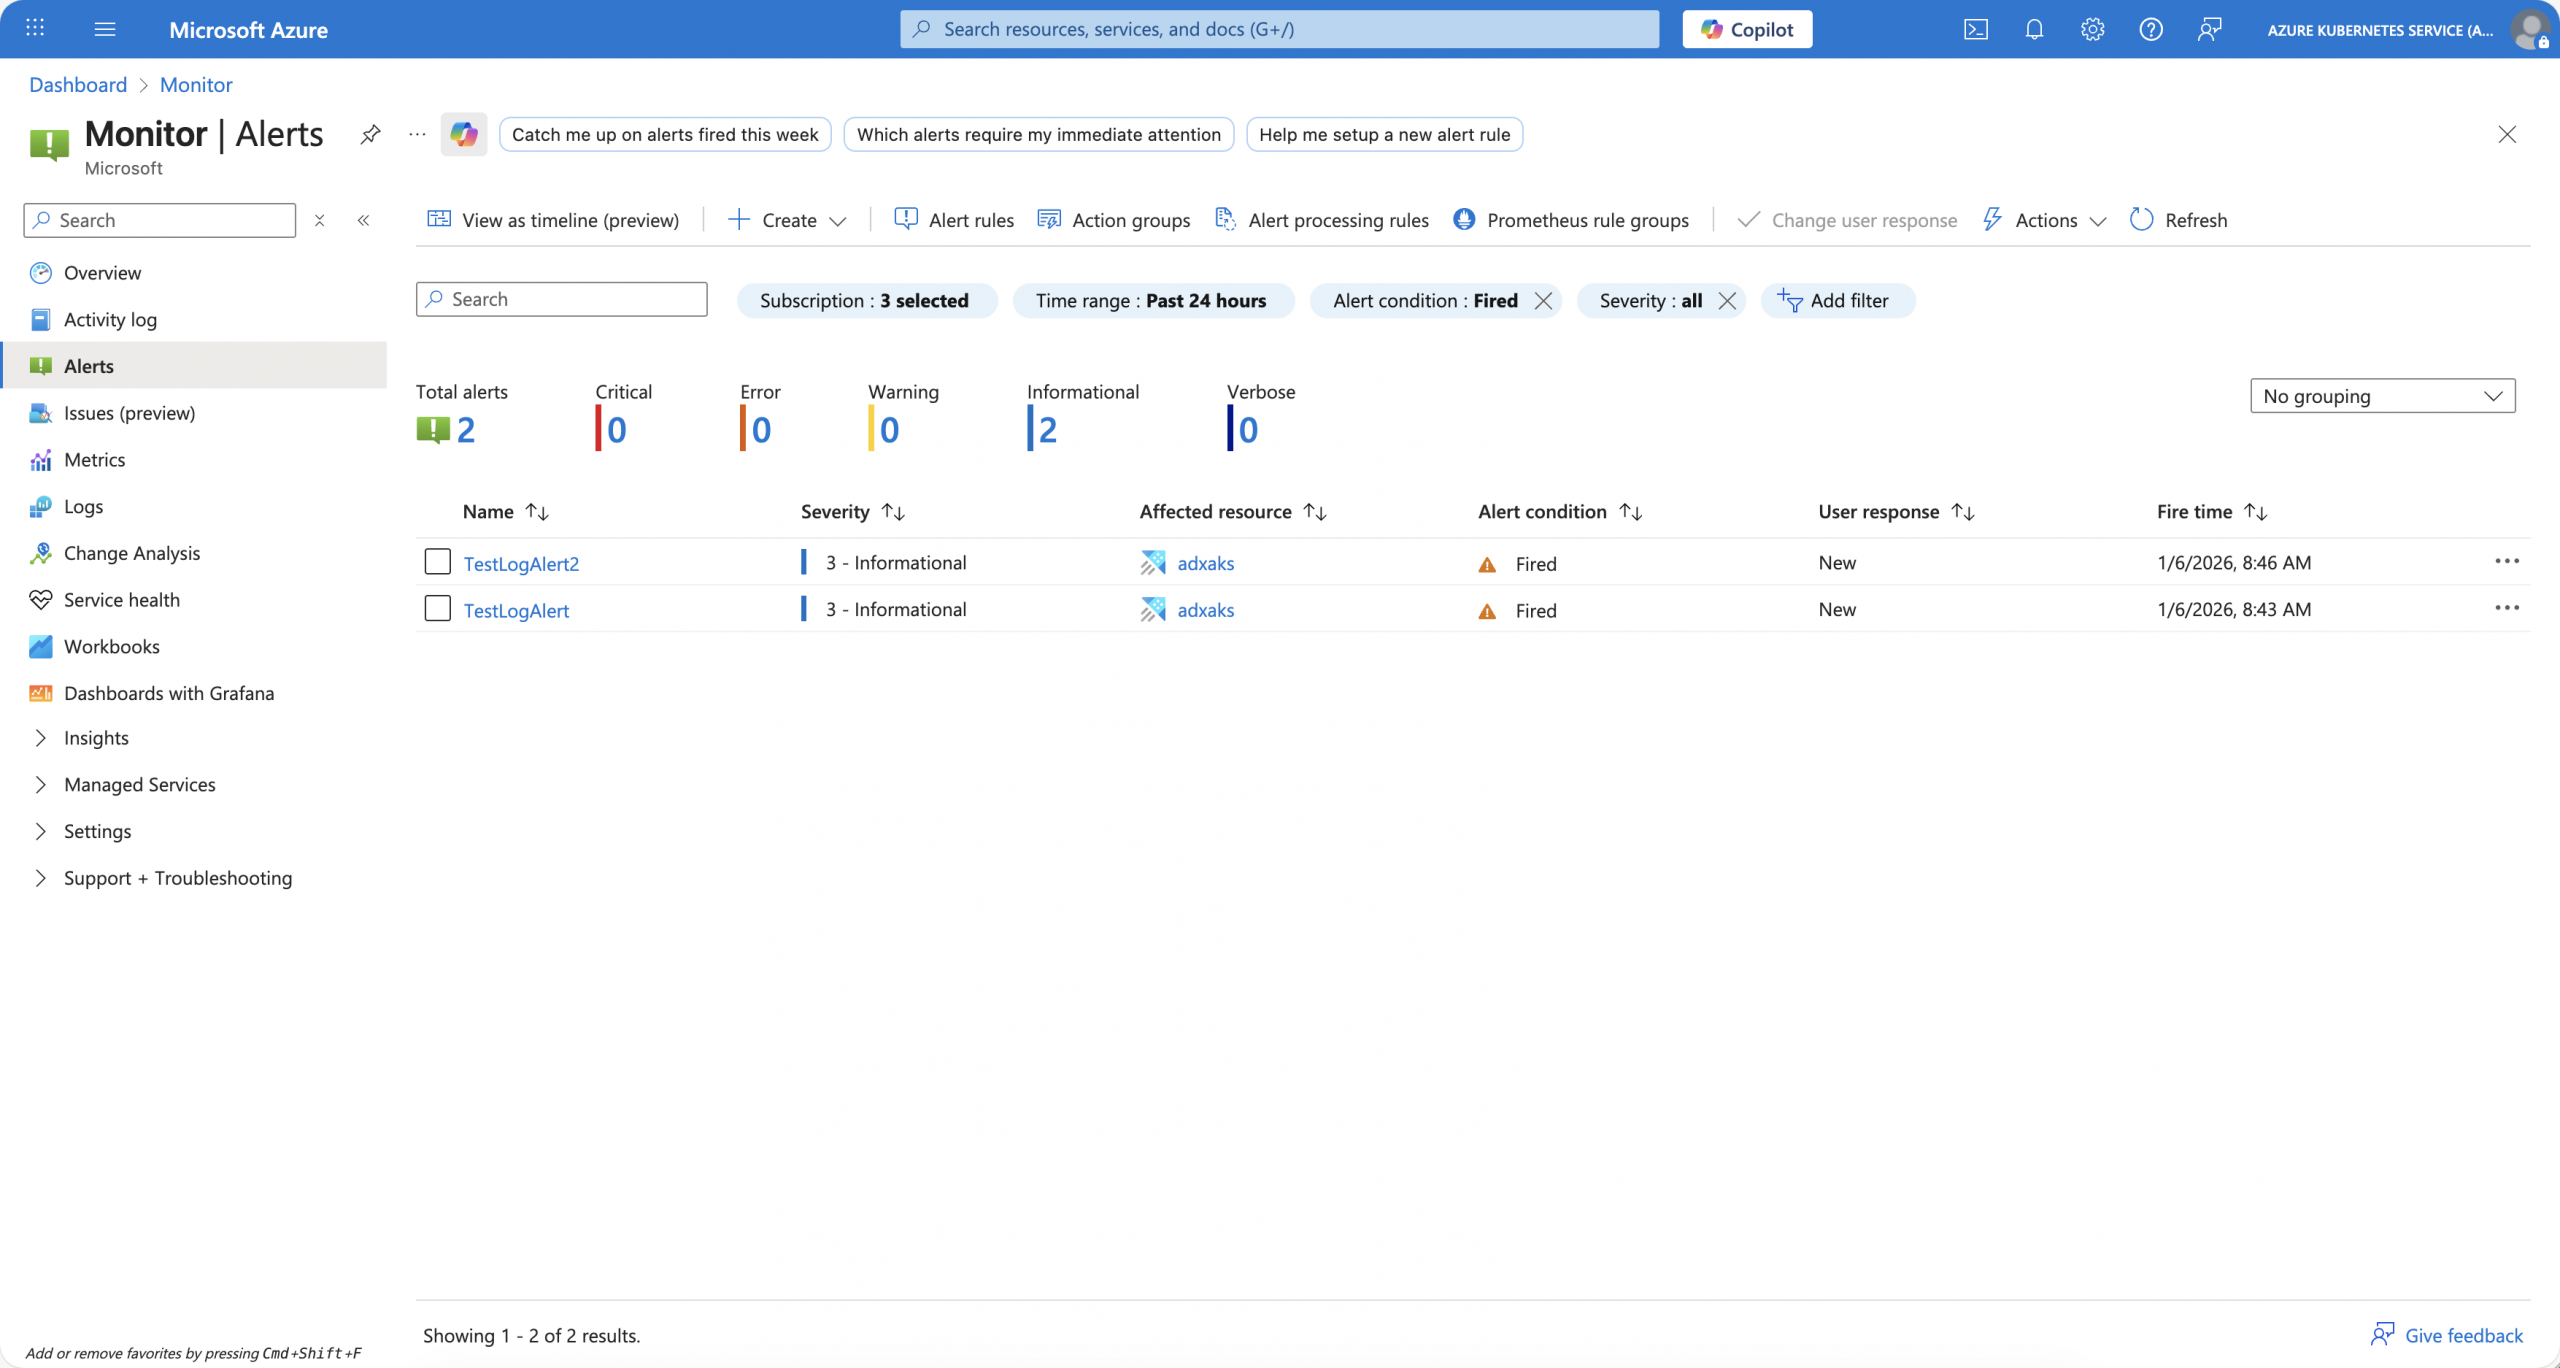
After a while, we see that both log alerts triggered successfully. One, where we use TimeGenerated as our timestamp column and are not required to specify the time range within the query, and the other one with the specific addition to the query.
Summary
When you want to use log alerts with Azure Data Explorer, you should keep the following points in mind to improve your log alert experience with Azure Data Explorer:
- Use a user-assigned managed identity for your log alerts.
- Assign the Reader role to the user-assigned managed identity on the Azure Data Explorer cluster and provide database viewer permissions either on the cluster or at the individual database level.
- Use a column called TimeGenerated in all your tables to store timestamp data. It allows you to use built-in functionality for the time range selection of your log alerts.
- When you run your Azure Data Explorer cluster with network restrictions, you need to allow inbound access from the AzureCloud service tag. Have a look at the following section, “Log Alerts and cross-service access” of the blog post: https://www.danielstechblog.io/azure-data-explorer-network-access-restrictions/