The last two blog posts of this series covered the setup of the Envoy Proxy ratelimit service and its implementation with Istio.
-> https://www.danielstechblog.io/run-the-envoy-proxy-ratelimit-service-for-istio-on-aks-with-azure-cache-for-redis/
-> https://www.danielstechblog.io/implement-rate-limiting-with-istio-on-azure-kubernetes-service/
In today’s post I walk you through on how to monitor the ratelimit service with Azure Monitor for containers. Not the standard monitoring of the container itself. We focus on the scraping of the Prometheus metrics exposed by the statsd-exporter.
statsd-exporter configuration adjustments
Per default metrics that have been sent to the statsd-exporter do not expire. Depending on the Azure Monitor agent collection interval, the default TTL in the statsd-exporter config map should match the collection interval. This guarantees accurate metrics of the ratelimit service in Azure Monitor.
In our example we set it to one minute.
...
---
apiVersion: v1
kind: ConfigMap
metadata:
  name: statsd-exporter-config
  namespace: ratelimit
data:
  config.yaml: |
    defaults:
      ttl: 1m # Resets the metrics every minute
    mappings:
...
For the config load metrics, we override the default TTL and set the value to three minutes. Otherwise, it might be that those metrics are not collected as those are only set ones during the container startup.
...
      - match:
          "ratelimit.service.config_load_success"
        name: "ratelimit_service_config_load_success"
        match_metric_type: counter
        ttl: 3m
      - match:
          "ratelimit.service.config_load_error"
        name: "ratelimit_service_config_load_error"
        match_metric_type: counter
        ttl: 3m
...
Ratelimit service deployment adjustments
Azure Monitor for containers supports different configuration options to scrape Prometheus metrics. The most convenient one is the monitoring of Kubernetes pods which have specific annotations set.
...
  template:
    metadata:
      labels:
        app: ratelimit
        version: v1
      annotations:
        prometheus.io/scrape: "true"
        prometheus.io/scheme: "http"
        prometheus.io/path: "/metrics"
        prometheus.io/port: "9102"
...
Additionally, we add an Istio specific annotation disabling the metrics merge.
...
        prometheus.istio.io/merge-metrics: "false"
...
-> https://istio.io/latest/docs/ops/integrations/prometheus/#option-1-metrics-merging
During my setup I discovered that the standard merge produces a male formatted result that the Azure Monitor agent cannot handle.
Network policy and peer authentication policy adjustments
As the ratelimit service namespace is locked down for inbound traffic and currently only allows GRPC traffic from the Istio ingress gateway to the ratelimit service we need to add another network policy.
...
apiVersion: networking.k8s.io/v1
kind: NetworkPolicy
metadata:
  name: allow-oms-agent
  namespace: ratelimit
spec:
  podSelector:
    matchLabels:
      app: ratelimit
  policyTypes:
  - Ingress
  ingress:
  - from:
      - namespaceSelector: {}
        podSelector:
          matchLabels:
            rsName: omsagent-rs
      - namespaceSelector: {}
        podSelector:
          matchLabels:
            component: oms-agent
    ports:
    - port: 9102
Without the additional network policy, the Azure Monitor agent cannot scrape the Prometheus metrics.
The same counts towards for the peer authentication policy. Per default services in our Istio service mesh use the mTLS mode STRICT.
Services that are not part of the mesh cannot talk to ones that are part of the mesh. Therefore, we set the mTLS mode for the metrics endpoint of the statsd-exporter to PERMISSIVE.
apiVersion: "security.istio.io/v1beta1"
kind: "PeerAuthentication"
metadata:
  name: "ratelimit"
  namespace: "ratelimit"
spec:
  selector:
    matchLabels:
      app: ratelimit
  portLevelMtls:
    8081:
      mode: PERMISSIVE
    9102:
      mode: PERMISSIVE
Otherwise, the Azure Monitor agent cannot scrape the metrics.
Azure Monitor for containers configuration
Microsoft provides a comprehensive documentation what can be configured.
-> https://docs.microsoft.com/en-us/azure/azure-monitor/containers/container-insights-agent-config
-> https://docs.microsoft.com/en-us/azure/azure-monitor/containers/container-insights-prometheus-integration
So, I keep the focus on what is configured in our example.
...
  prometheus-data-collection-settings: |-
    [prometheus_data_collection_settings.cluster]
      interval = "1m"
      fieldpass = [
        "ratelimit_service_config_load_success",
        "ratelimit_service_config_load_error",
        "ratelimit_service_rate_limit_near_limit",
        "ratelimit_service_rate_limit_over_limit",
        "ratelimit_service_rate_limit_total_hits",
        "ratelimit_service_rate_limit_within_limit",
        "ratelimit_service_should_rate_limit_error",
        "ratelimit_service_total_requests",
        "ratelimit_service_response_time_seconds"
      ]
      monitor_kubernetes_pods = true
      monitor_kubernetes_pods_namespaces = ["ratelimit"]
First, as earlier mentioned in this blog post the scraping interval is configured to one minute. We do not want to scrape all metrics from the statsd-exporter of our ratelimit service. Hence, we use the fieldpass option only scarping metrics we want.
Additionally, we limit the pod monitoring only to the ratelimit service namespace and enable the monitoring.
Run KQL queries
After we applied all configuration adjustments to our Azure Kubernetes Service cluster, we can start to run KQL queries analyzing the ingested metrics.
The first KQL query returns the results for the config load metrics.
InsightsMetrics
| where Namespace == "prometheus"
| where Name =='ratelimit_service_config_load_success' or Name =='ratelimit_service_config_load_error'
| extend json = todynamic(Tags)
| extend Pod = tostring(json.pod_name)
| summarize count() by Pod, Name, Value=Val
| render columnchart
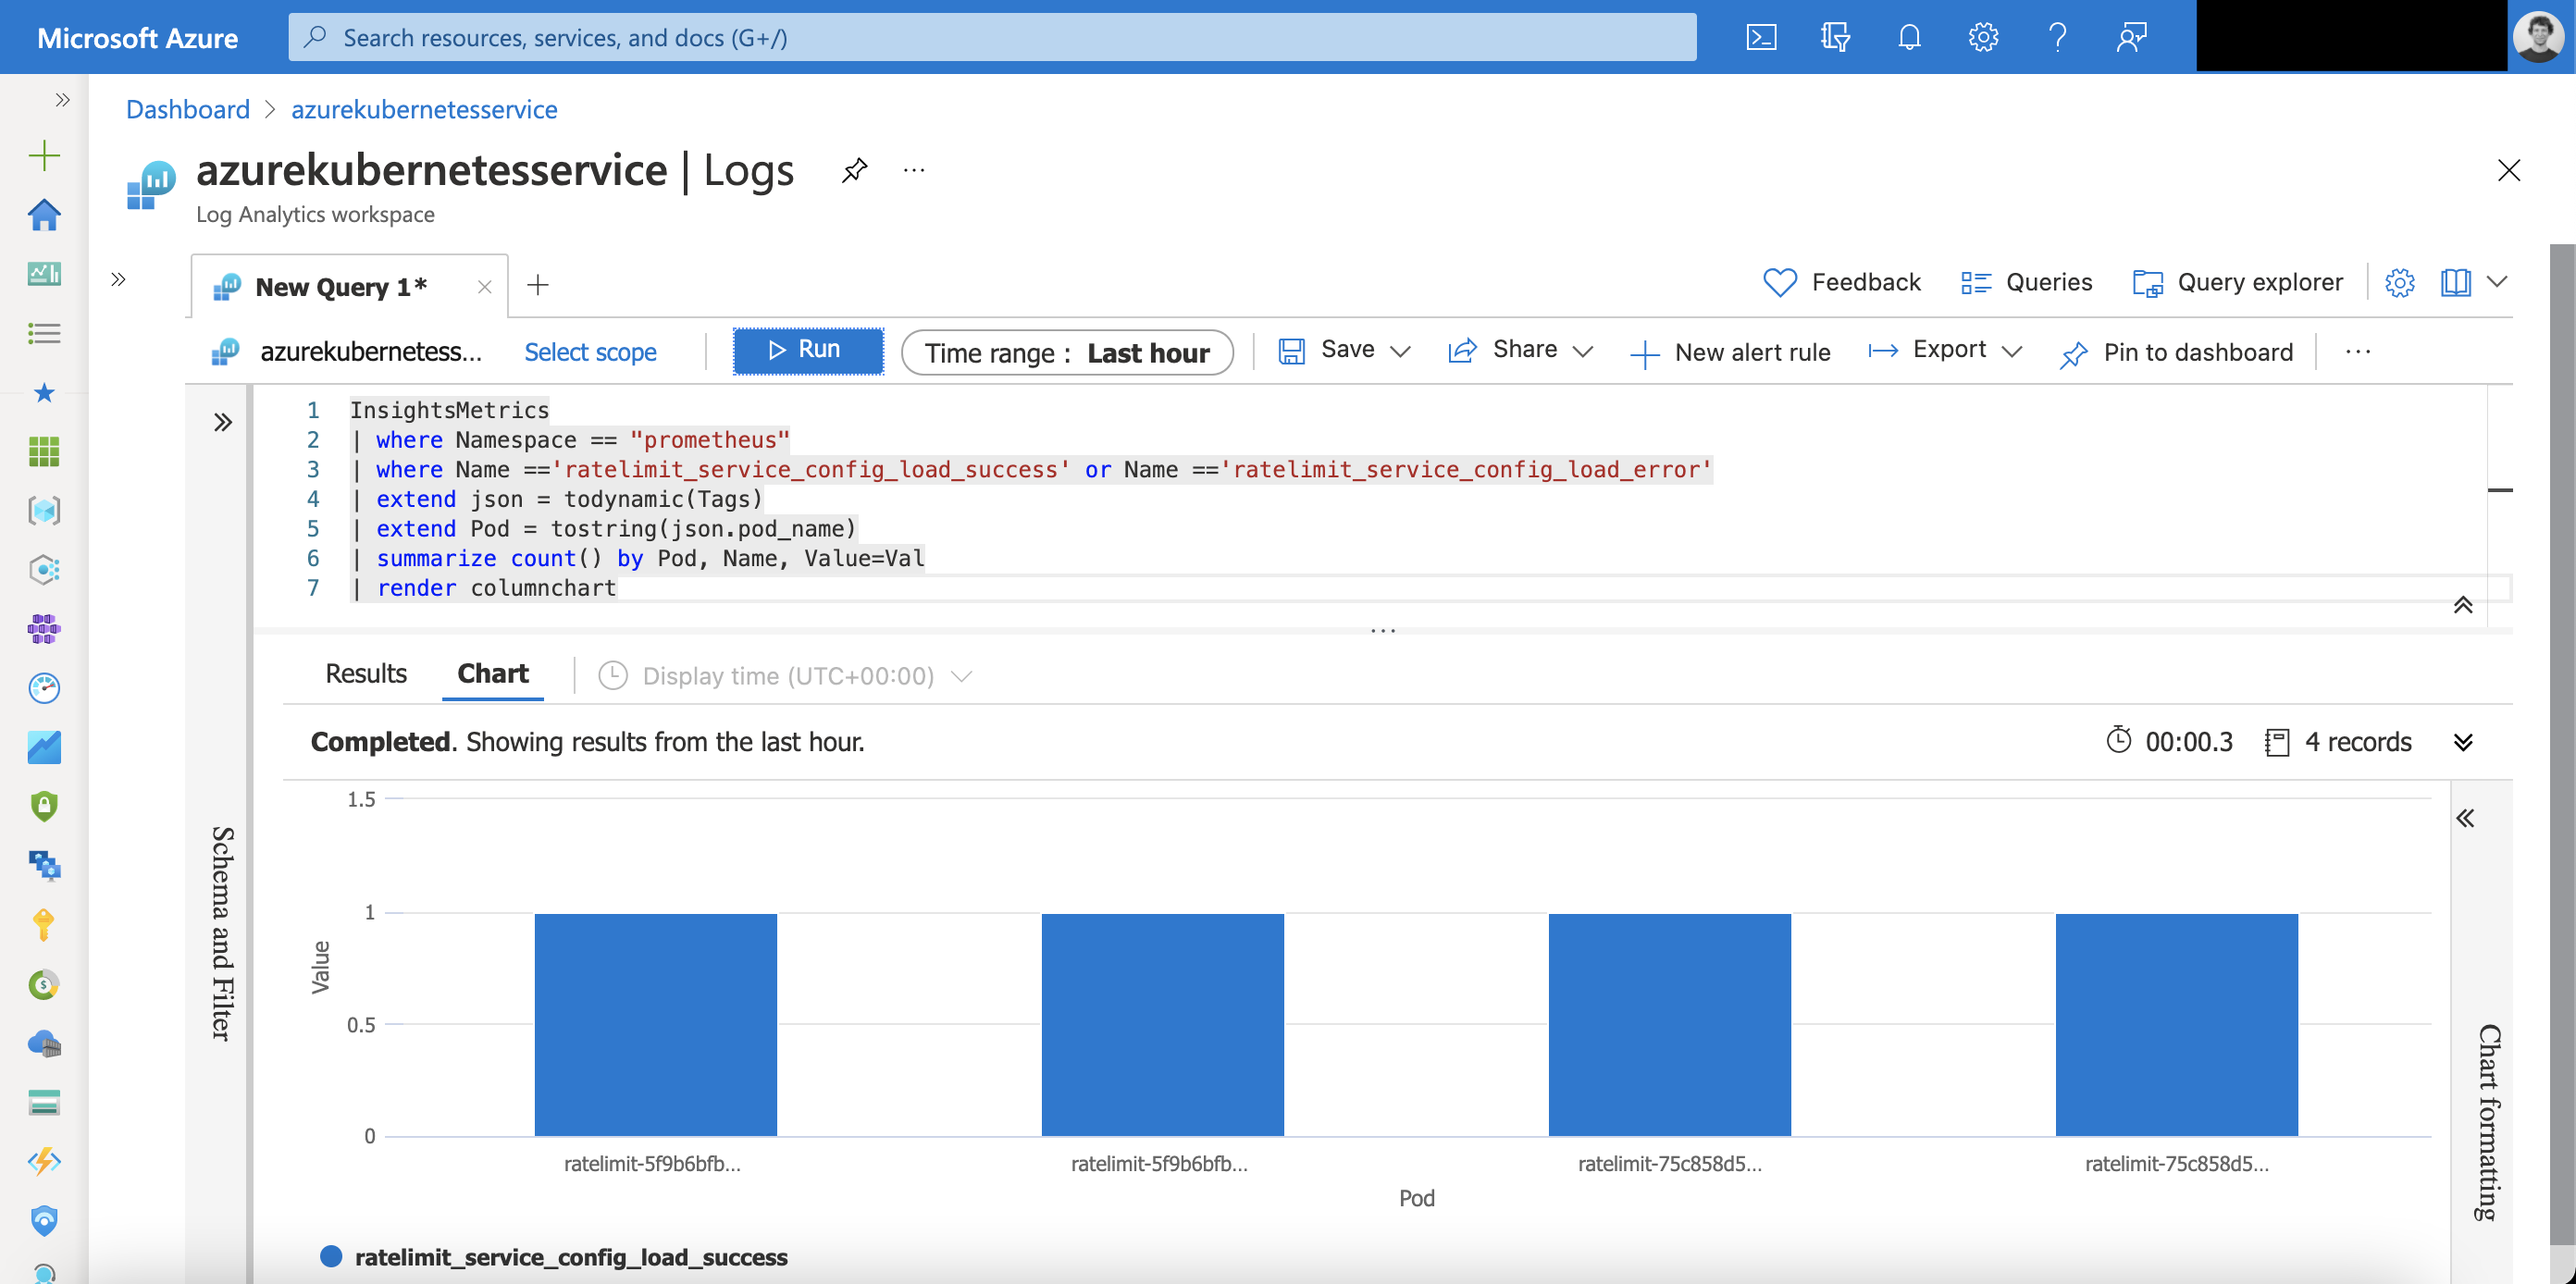
As seen in the screenshot the config load of the ratelimit service was successful and the ratelimit service is operational.
Another KQL query shows the different metrics for the rate limiting.
InsightsMetrics
| where Namespace == "prometheus"
| where Name =='ratelimit_service_rate_limit_total_hits' or Name == 'ratelimit_service_rate_limit_near_limit' or Name == 'ratelimit_service_rate_limit_over_limit' or Name == 'ratelimit_service_rate_limit_within_limit'
| extend json = todynamic(Tags)
| where json.key1 == 'PATH_/src-ip'
| project TimeGenerated, Name, Sum=Val
| render columnchart

The metrics for ratelimit_service_rate_limit_over_limit in this specific example is in total 12.
Beside this metric there is another way to receive information about specific paths that hit the rate limit. This only requires that the Istio logging is enabled.
ContainerLog
| where ContainerID == 'b07608b4e81be5f5e515255b954832dc0a56772303ca3d4fc0c9a44e7bcfa301' or ContainerID == 'fb91ee37f6e1b9b0f57d4b47cf2391f72bb4327f9bafa1e8df653bbdfe91a5af'
| extend json = todynamic(LogEntry)
| where json.response_code == '429' and json.path == '/src-ip'
| summarize count=count() by tostring(json.response_code), tostring(json.response_code_details), tostring(json.path), tostring(json.authority)
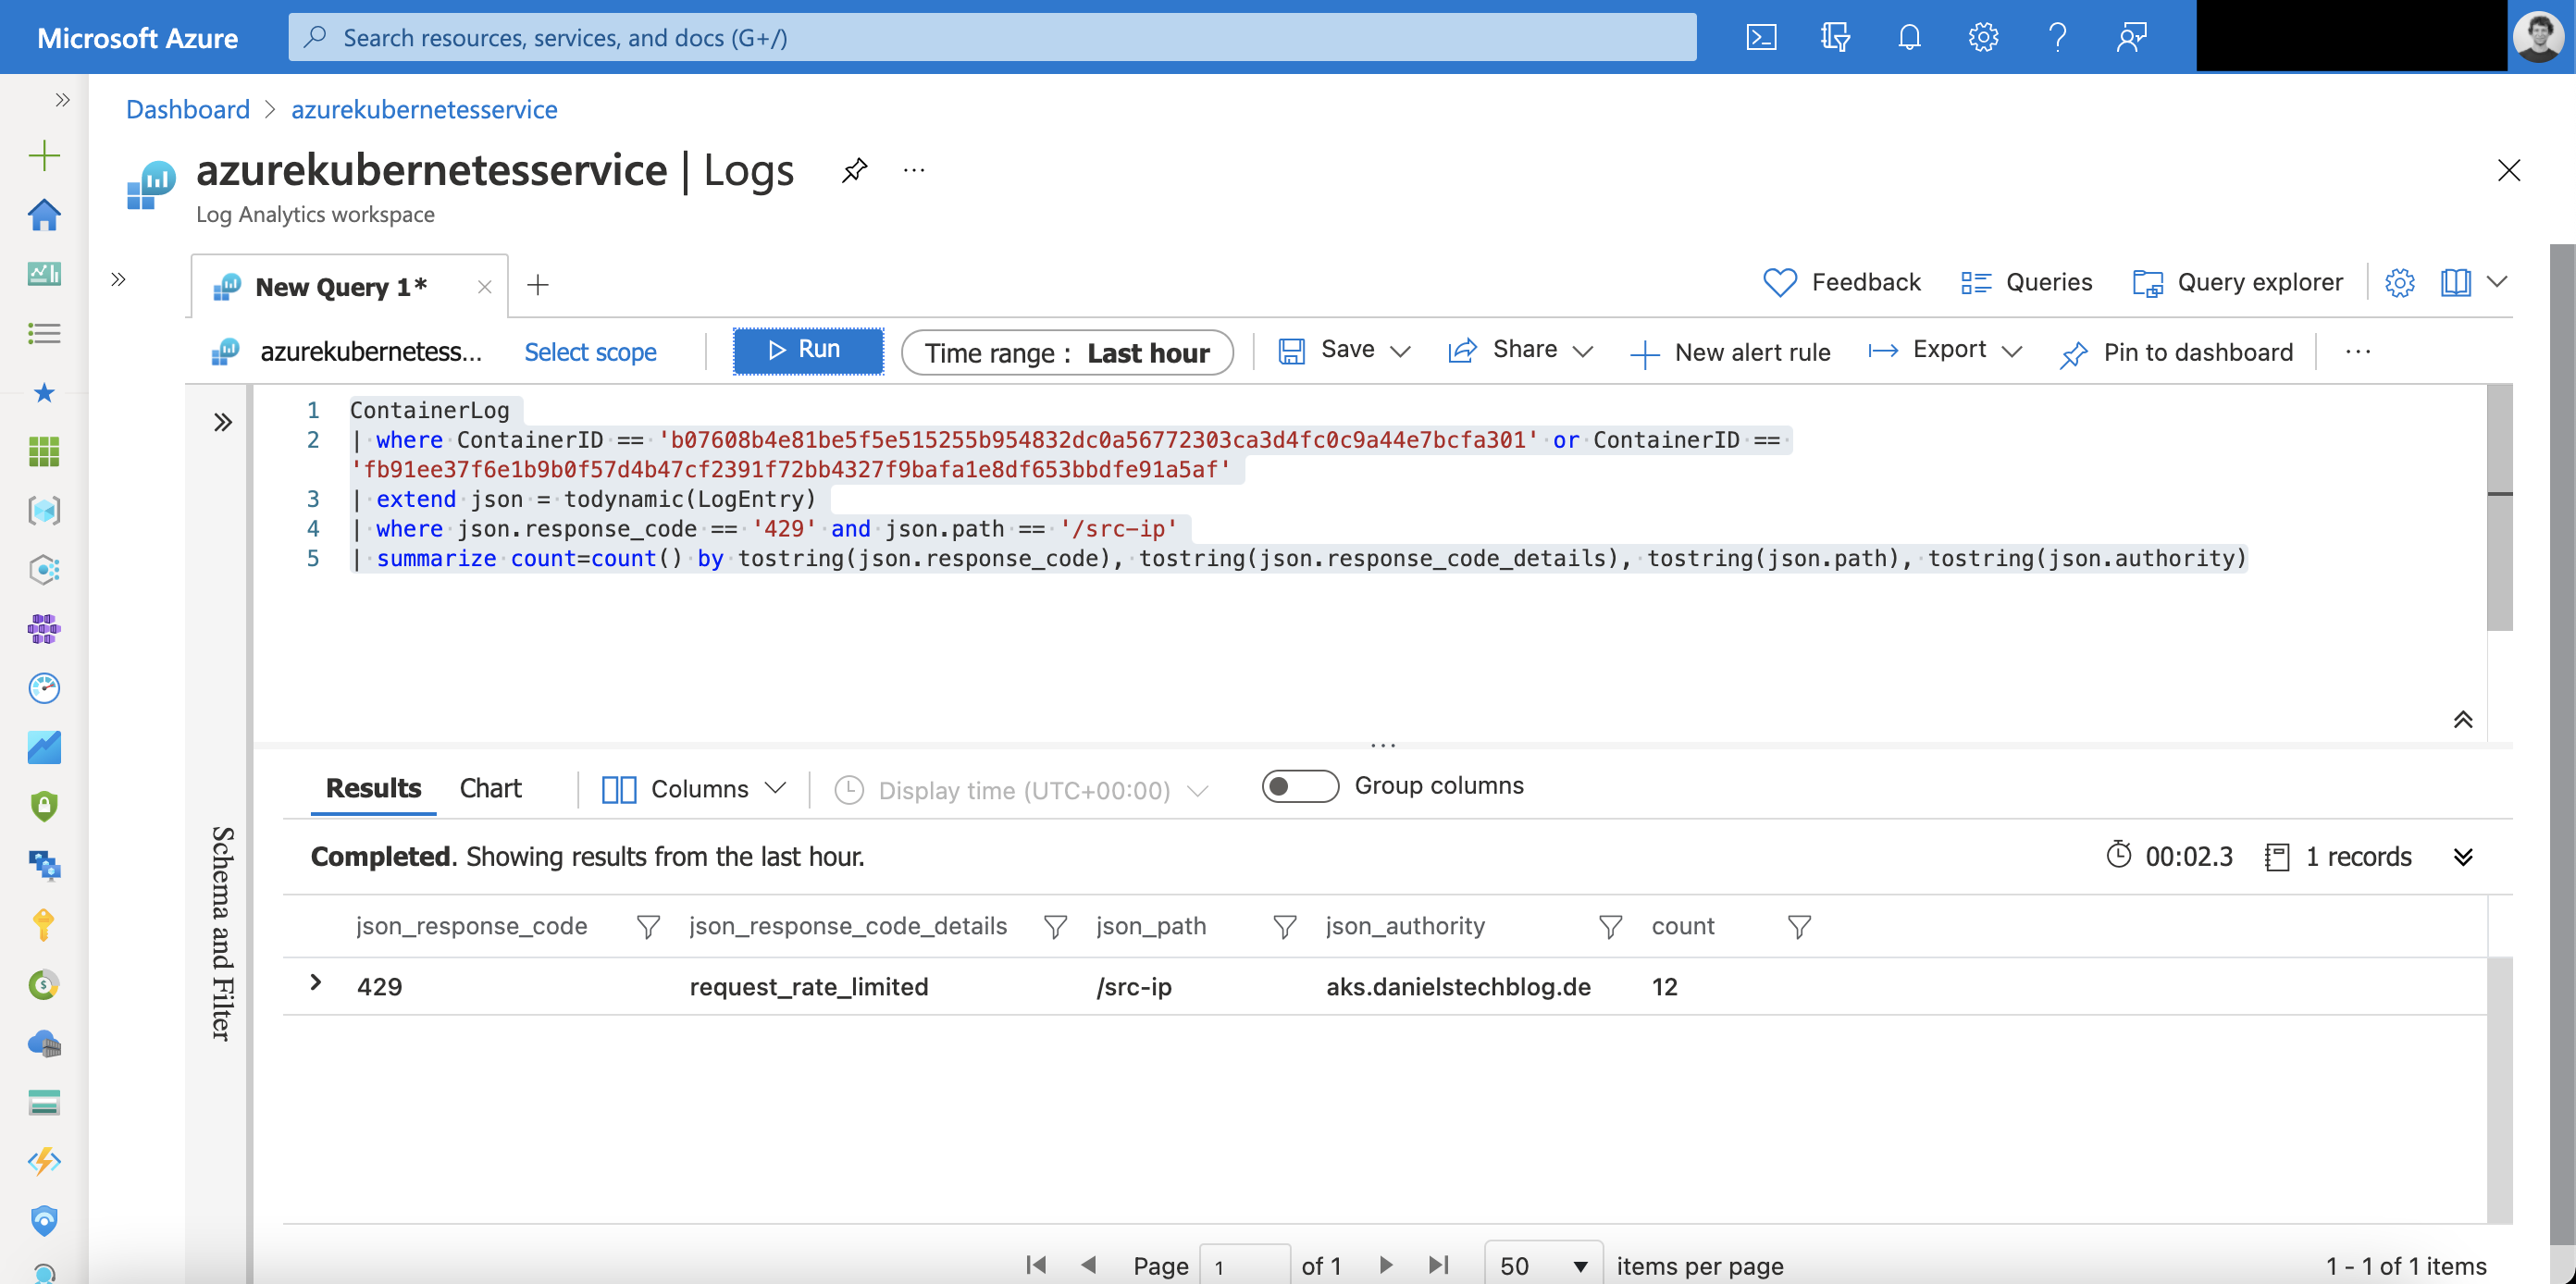
We have the same number of requests that got rate limited and did not need to scrape Prometheus metrics from the ratelimit service for it. Depending on how much insights you want the Istio logging might be enough. For deeper insights I recommend scraping the Prometheus metrics.
Summary
This is the last blog post of this series where we started with how to run the Envoy Proxy ratelimit service, implement the rate limiting with Istio and ended the topic how to monitor the ratelimit service.
-> https://www.danielstechblog.io/run-the-envoy-proxy-ratelimit-service-for-istio-on-aks-with-azure-cache-for-redis/
-> https://www.danielstechblog.io/implement-rate-limiting-with-istio-on-azure-kubernetes-service/
-> https://github.com/neumanndaniel/kubernetes/tree/master/envoy-ratelimit
I hope you got some useful information and insights on how to implement rate limiting for Istio on your AKS cluster and protect your microservices from being overloaded.