This is the second part of a three-part series about “Learnings from the field – Running Fluent Bit on Azure Kubernetes Service”.
-> https://www.danielstechblog.io/learnings-from-the-field-running-fluent-bit-on-azure-kubernetes-service-part-1/
-> https://www.danielstechblog.io/learnings-from-the-field-running-fluent-bit-on-azure-kubernetes-service-part-2/
Logging is one of the central aspects when operating Kubernetes. The easiest way to get started with it is by using the solution your cloud provider provides. On Azure, this is Azure Monitor Container Insights that can also be used on Google Kubernetes Engine and Amazon Elastic Kubernetes Service via Azure Arc.
When you look for a platform-agnostic approach that is also highly customizable, you probably end up with Fluent Bit. Besides running Fluent Bit on Kubernetes for your container logs, you can run it on VMs or bare-metal servers for logging. Nevertheless, the focus in this series is on Fluent Bit running on Azure Kubernetes Service and using Azure Log Analytics as the logging backend.
I share with you specific learnings from the field operating Fluent Bit on Azure Kubernetes Service.
Do I need to gather logs from Fluent Bit?
It is a debatable topic if you should gather logs from Fluent Bit or not as you would do it with Fluent Bit itself. From my experience, the answer is a simple yes. So, let me explain how I came to this conclusion.
First, it does not make sense to have a second tool/service to get logs from your logging tool. It is the same topic as how to monitor your monitoring tool. But back to the topic do I need to gather logs from Fluent Bit.
As I already said the answer is yes. Otherwise, you are unaware of certain things that happen during the operation of Fluent Bit. Without gathering the logs of Fluent Bit, you cannot easily get an alert, for instance, about the situation when you ingest logs without Kubernetes metadata information. I covered that topic in the first part of the series. The log line to trigger an alert for this issue is the following one.
[2023/01/09 20:48:14] [ warn] [http_client] cannot increase buffer: current=32000 requested=64768 max=32000
What limitations exist?
Gathering Fluent Bit log data by Fluent Bit itself has its limits when it comes to the situation to detect issues with log ingestion or losing log data.
It depends on which log chunk those log data get placed in and if this specific log chunk gets flushed successfully to the logging backend.
Even under these circumstances, it is possible to detect issues with log ingestion or losing log data. You should focus on the following six log lines for detecting those kinds of problems.
1.) [2023/03/14 08:04:02] [ info] [input:storage_backlog:storage_backlog.2] register tail.0/1-1678779305.952848590.flb
2.) [2023/03/14 08:04:03] [ info] [input:storage_backlog:storage_backlog.2] queueing tail.0:1-1678779305.952848590.flb
3.) [2023/03/14 08:04:17] [ info] [engine] flush backlog chunk '1-1678779305.952848590.flb' succeeded: task_id=3, input=storage_backlog.2 > output=logs_output (out_id=0)

4.) [2023/03/13 23:54:16] [ info] [engine] flush chunk '1-1678751635.483713953.flb' succeeded at retry 1: task_id=0, input=logs_input > output=logs_output (out_id=0)
5.) [2023/03/13 23:54:10] [ warn] [engine] failed to flush chunk '1-1678751635.483713953.flb', retry in 6 seconds: task_id=0, input=logs_input > output=logs_output (out_id=0)

6.) [2023/03/14 07:22:47] [ warn] [net] getaddrinfo(host='xxxxxxxx-xxxx-xxxx-xxxx-xxxxxxxxxxxx.ods.opinsights.azure.com', err=12): Timeout while contacting DNS servers
The first three focus on the filesystem buffering after a Fluent Bit pod restart or a Kubernetes node reboot to apply security patches or even a Kubernetes node crash following a restart. Counting those log lines independently should result in the same amount when compared to each other.

Register means that Fluent Bit is aware of those log chunks in the filesystem buffer. The status queueing represents that the log chunks are ready to be flushed to the logging backend. Finally, when they have been flushed successfully to the logging backend you see the third log line.
Also, for the fourth and fifth log lines, the count should be the same when comparing the results.
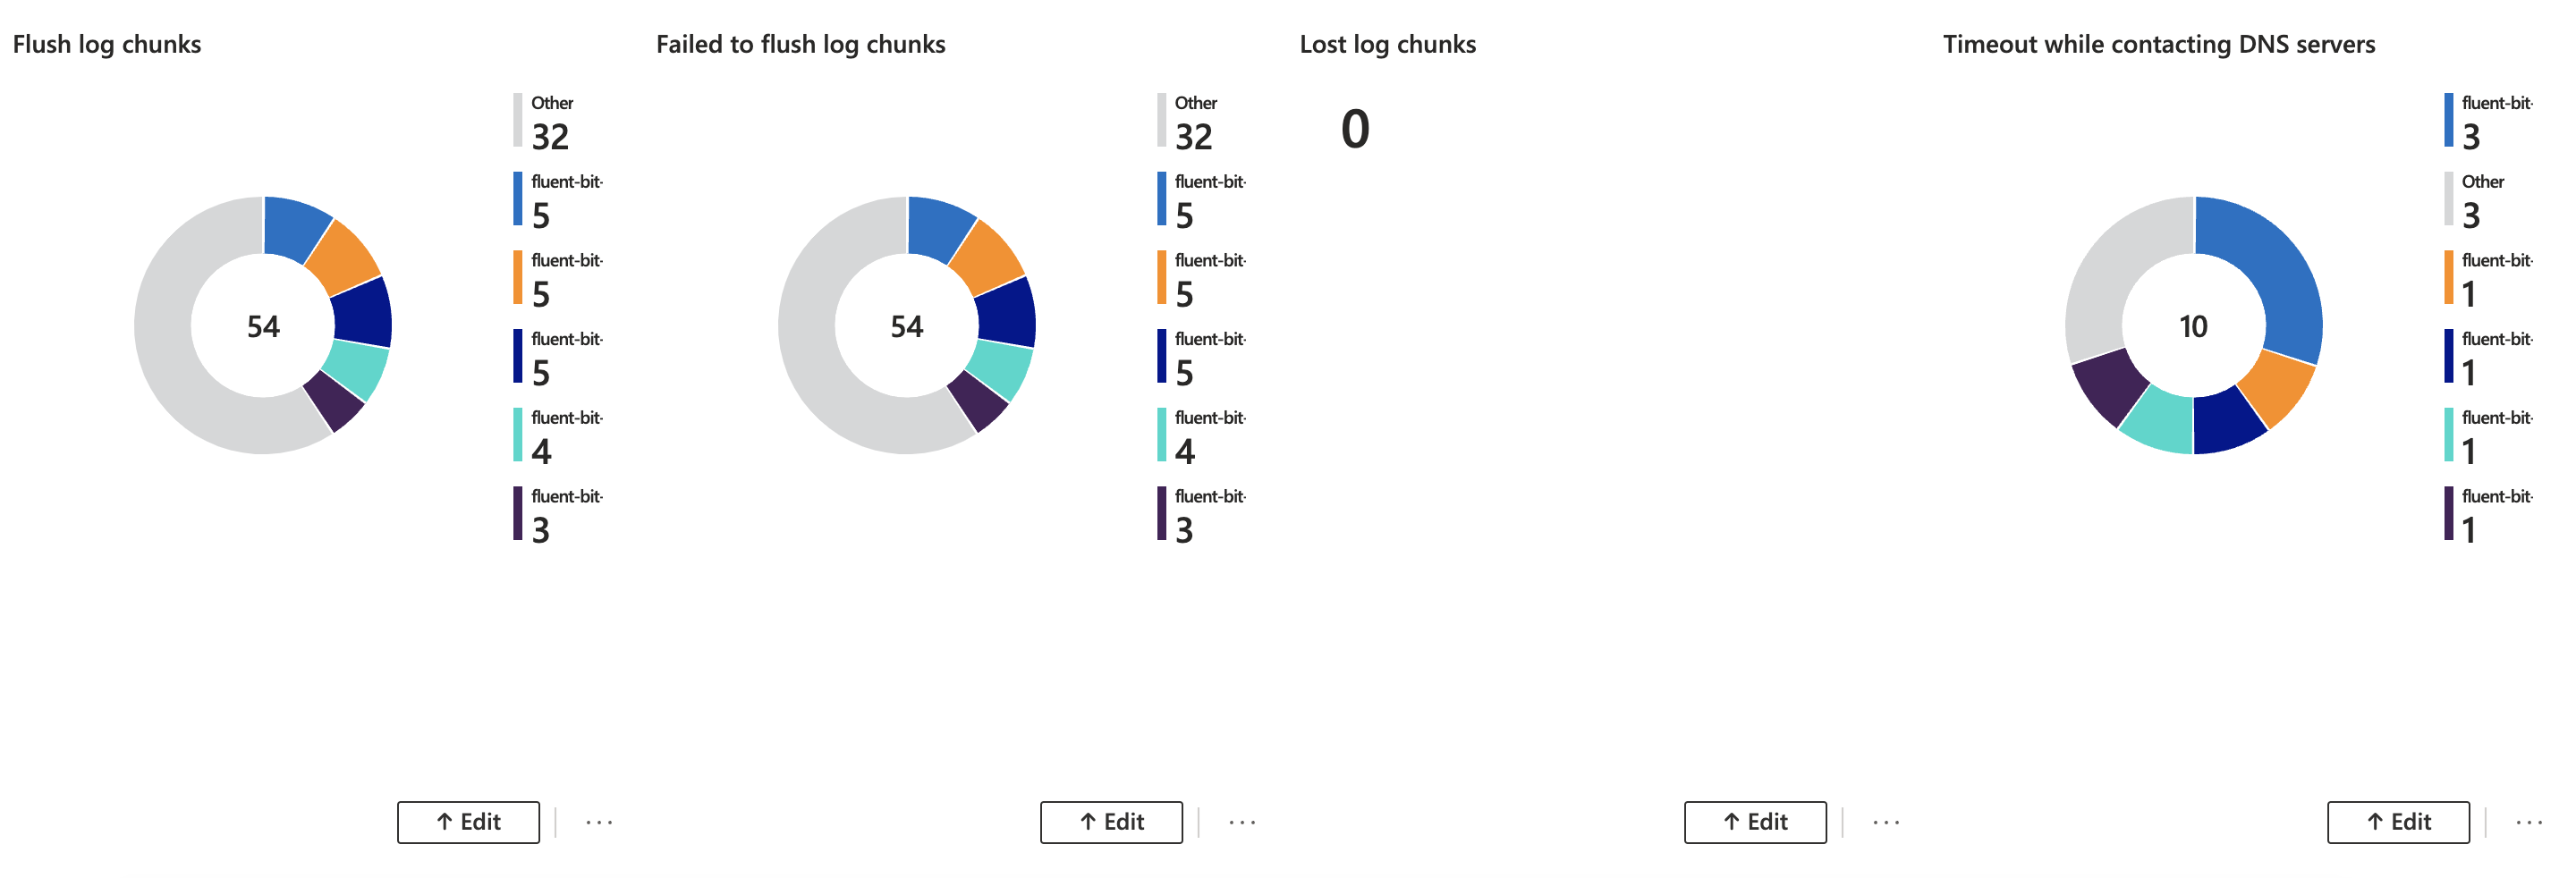
The focus here is on log chunks in memory. There are only two states “failed to flush” and “flush succeeded”.
When for whatever reason in both cases, filesystem buffering or in memory, the count differs from each other, you can be assured that you lost some log data.
Another good indication of issues with the log ingestion is the sixth log line. Especially, when your logging backend is addressed via a DNS domain name. A large number of those log lines will correlate with log lines four and five. Where the “failed to flush” count is larger than the “flush succeeded”.
Summary
This was the last part of a three-part series about “Learnings from the field – Running Fluent Bit on Azure Kubernetes Service”.
I hope you got some valuable insights that help you to run Fluent Bit on Azure Kubernetes Service with Azure Log Analytics as the logging backend.
The learnings apply to every other Kubernetes environment where you run Fluent Bit on. Even the focus in this series was on Azure Kubernetes Service and Azure Log Analytics.