It does not matter if your AKS cluster is running without any issues or you currently experiencing issues, you should run Azure Kubernetes Service Diagnostics on a regular base.
But what is Azure Kubernetes Service Diagnostics? Let me give you a quick introduction.
AKS Diagnostics is a functionality in the Azure portal which provides you with the capability to run a self-diagnosis against your AKS cluster. The Cluster Insights run consists of several checks covering a broad spectrum of issues that may prevent the AKS cluster to be manageable.
-> https://docs.microsoft.com/en-us/azure/aks/concepts-diagnostics#cluster-insights
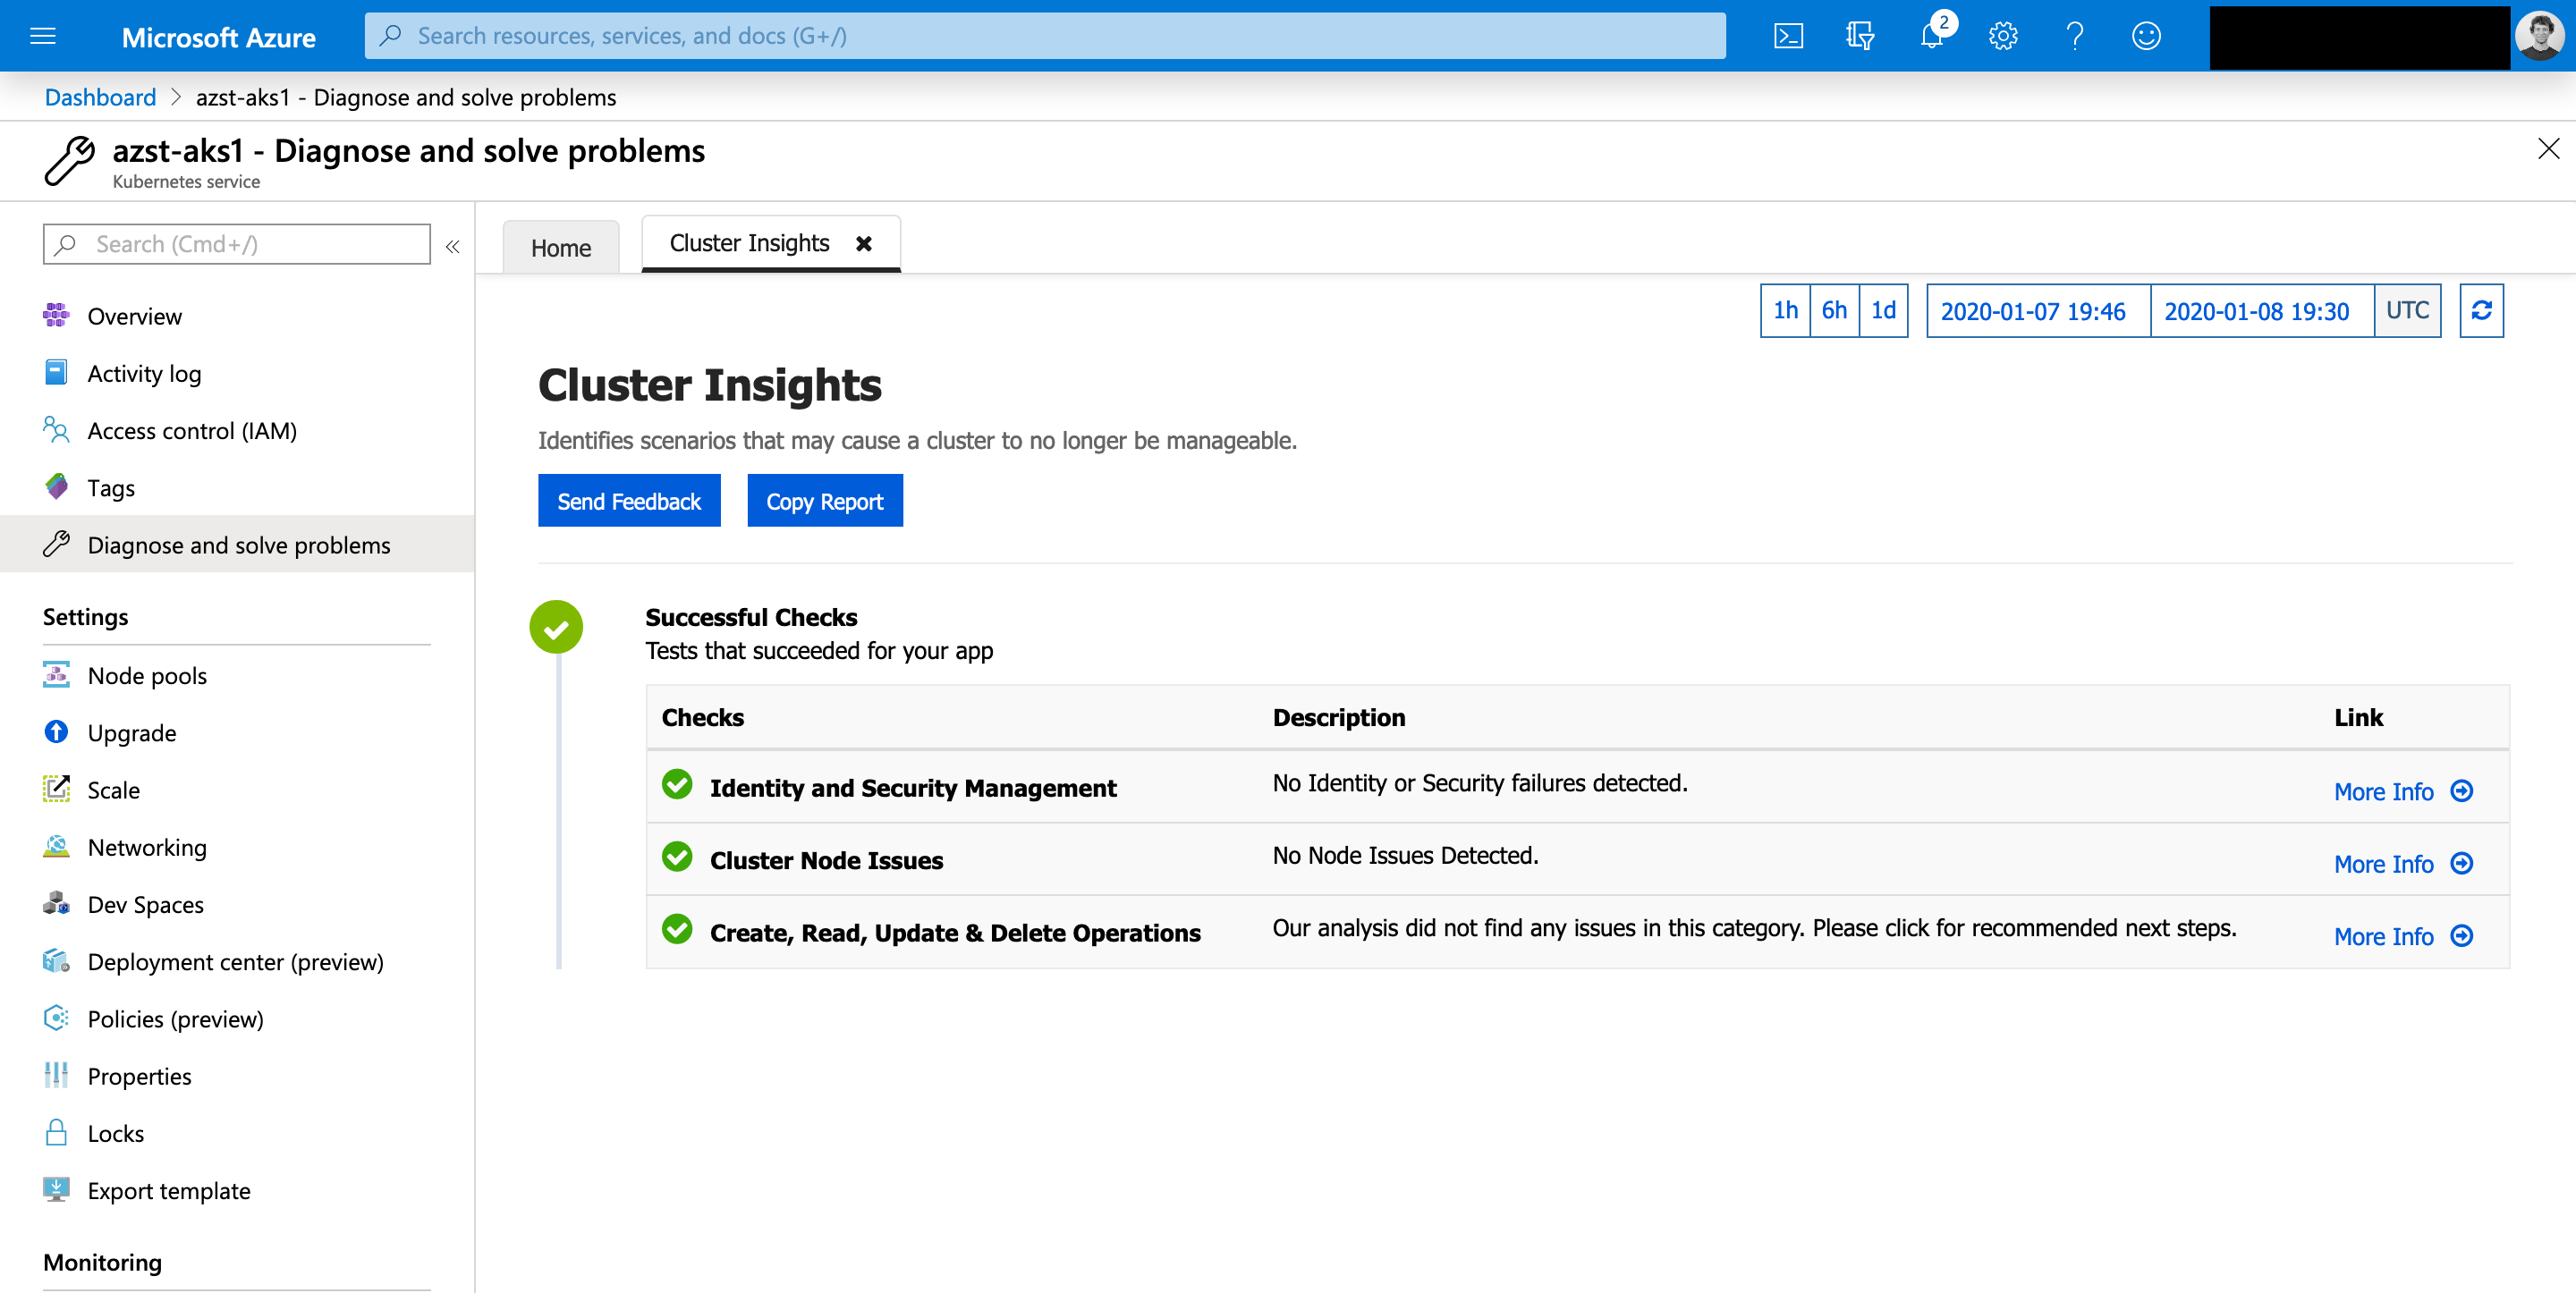
You execute the AKS Diagnostics run on each cluster separately by selecting “Diagnose and solve problems” in the left menu bar of the AKS blade in the Azure portal. This brings you to the Azure Kubernetes Service Diagnostics part and you can start the run with a click on Cluster Insights.

Depending on the AKS cluster size, number of nodes in the cluster, the checks run between a couple of seconds or minutes. Normally, you should receive a healthy status as seen in the following screenshot.
Otherwise you see a red exclamation mark and the check that failed.
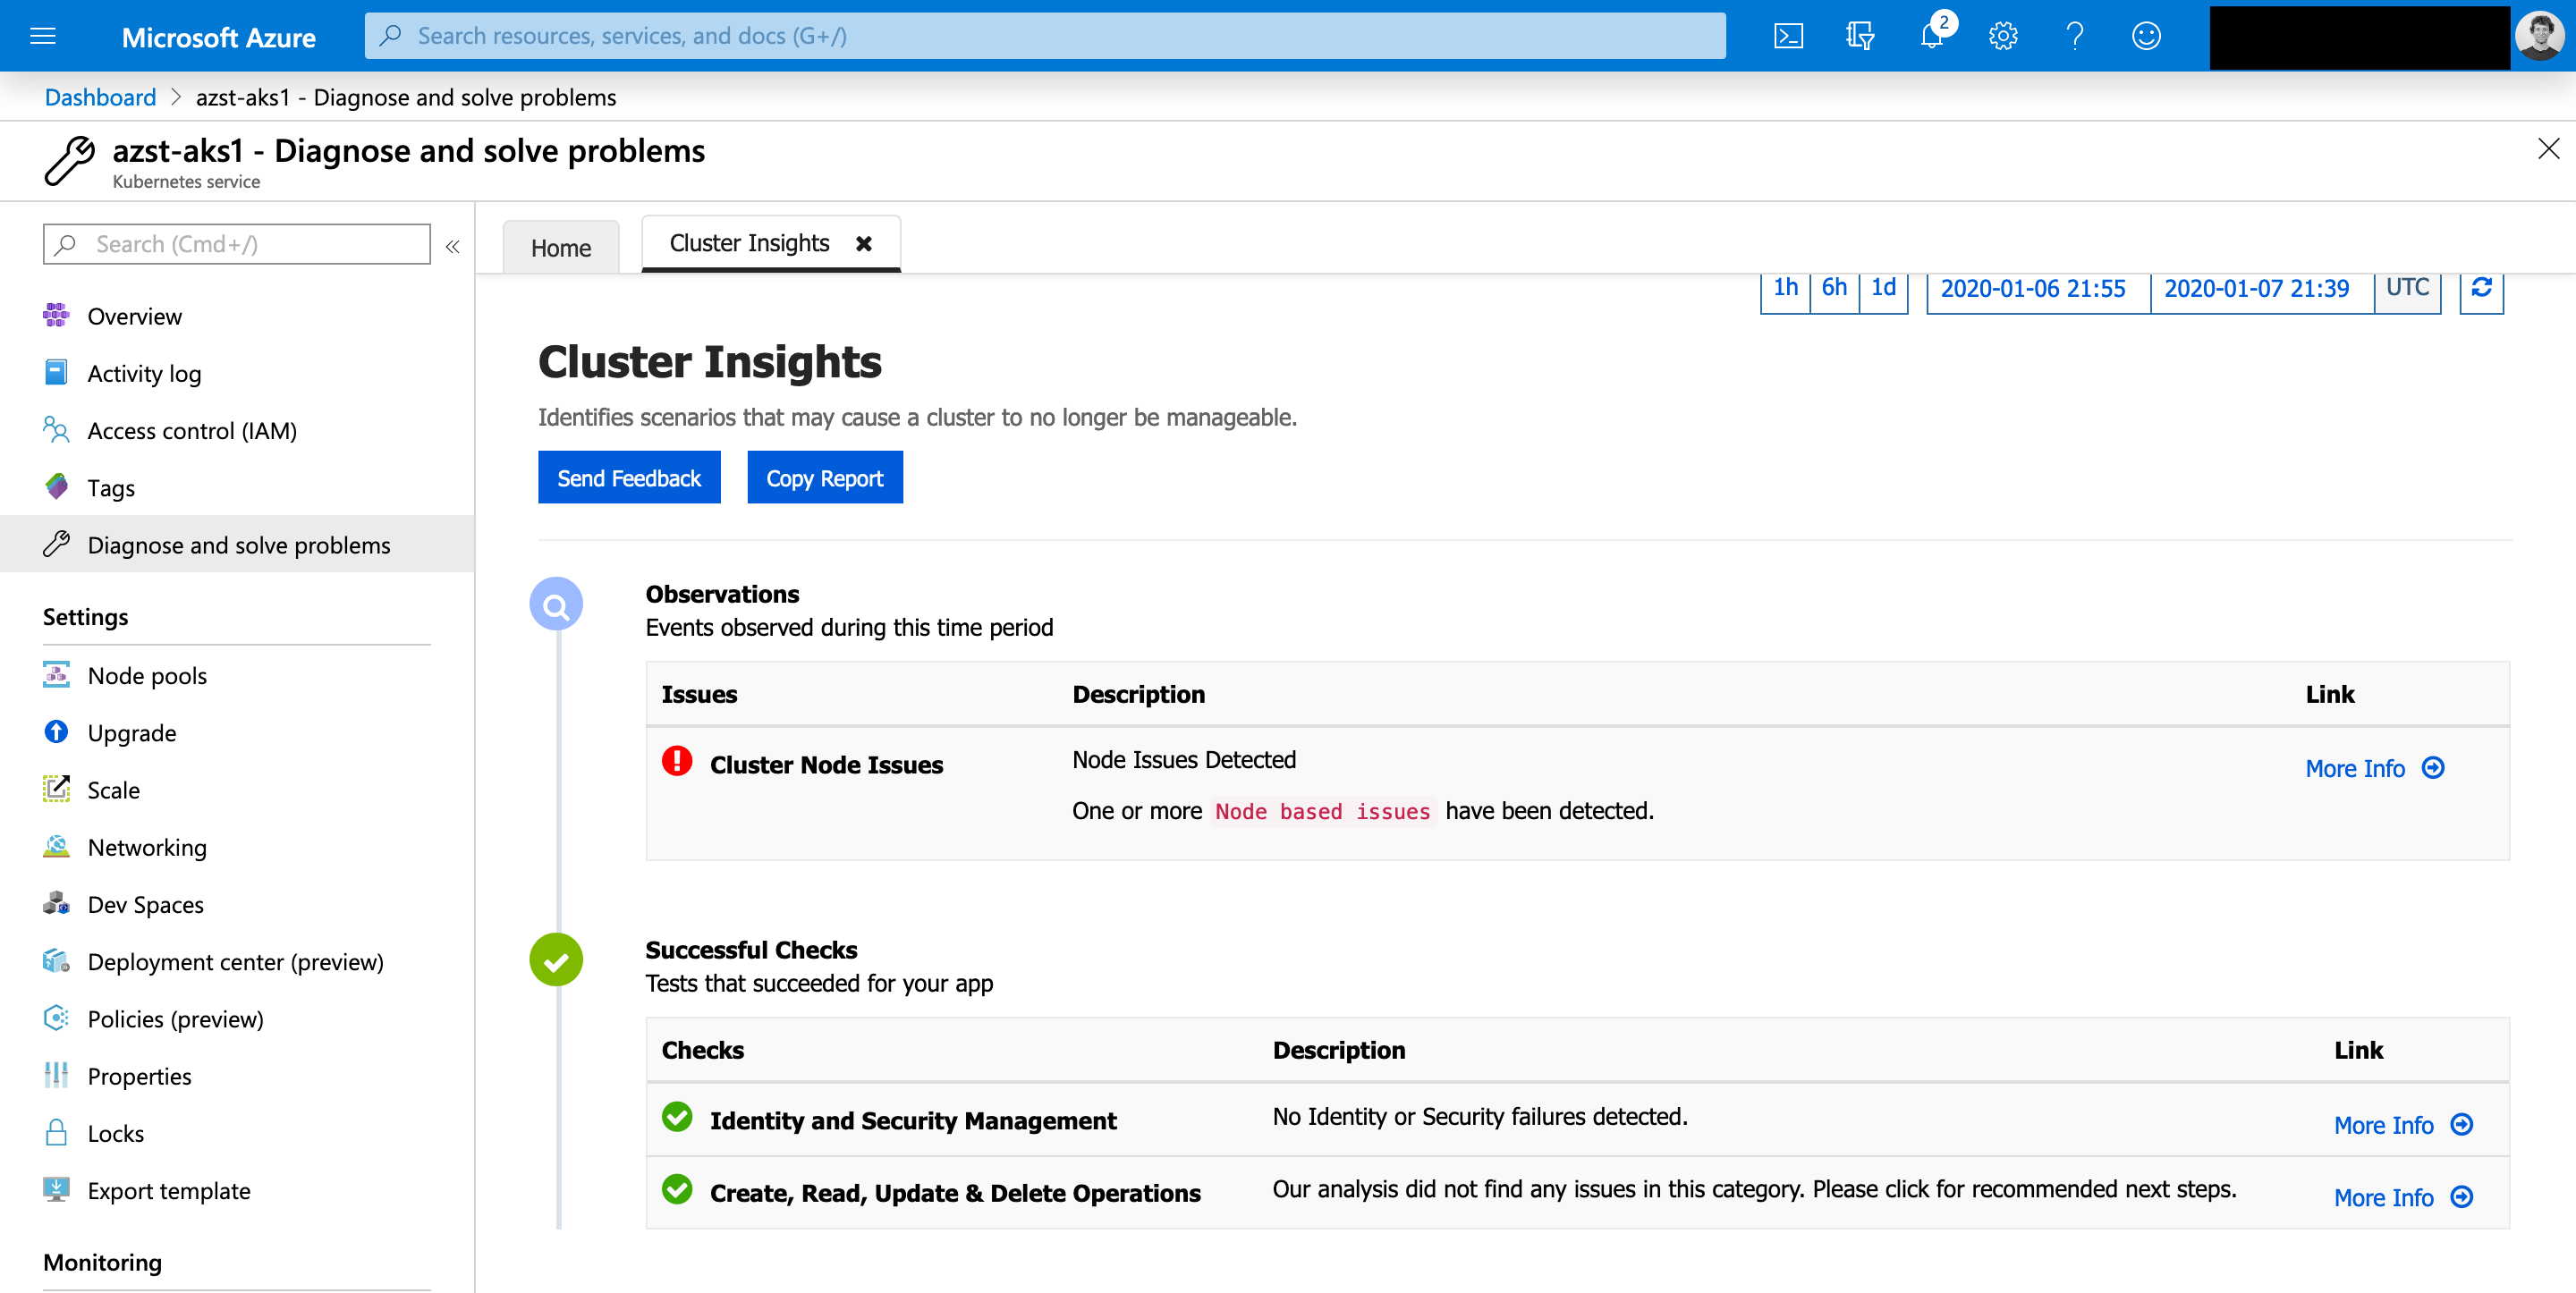
In this specific case the Cluster Node check failed. Investigating the issue further just click on “More info” on the right-hand side to get more detailed information.
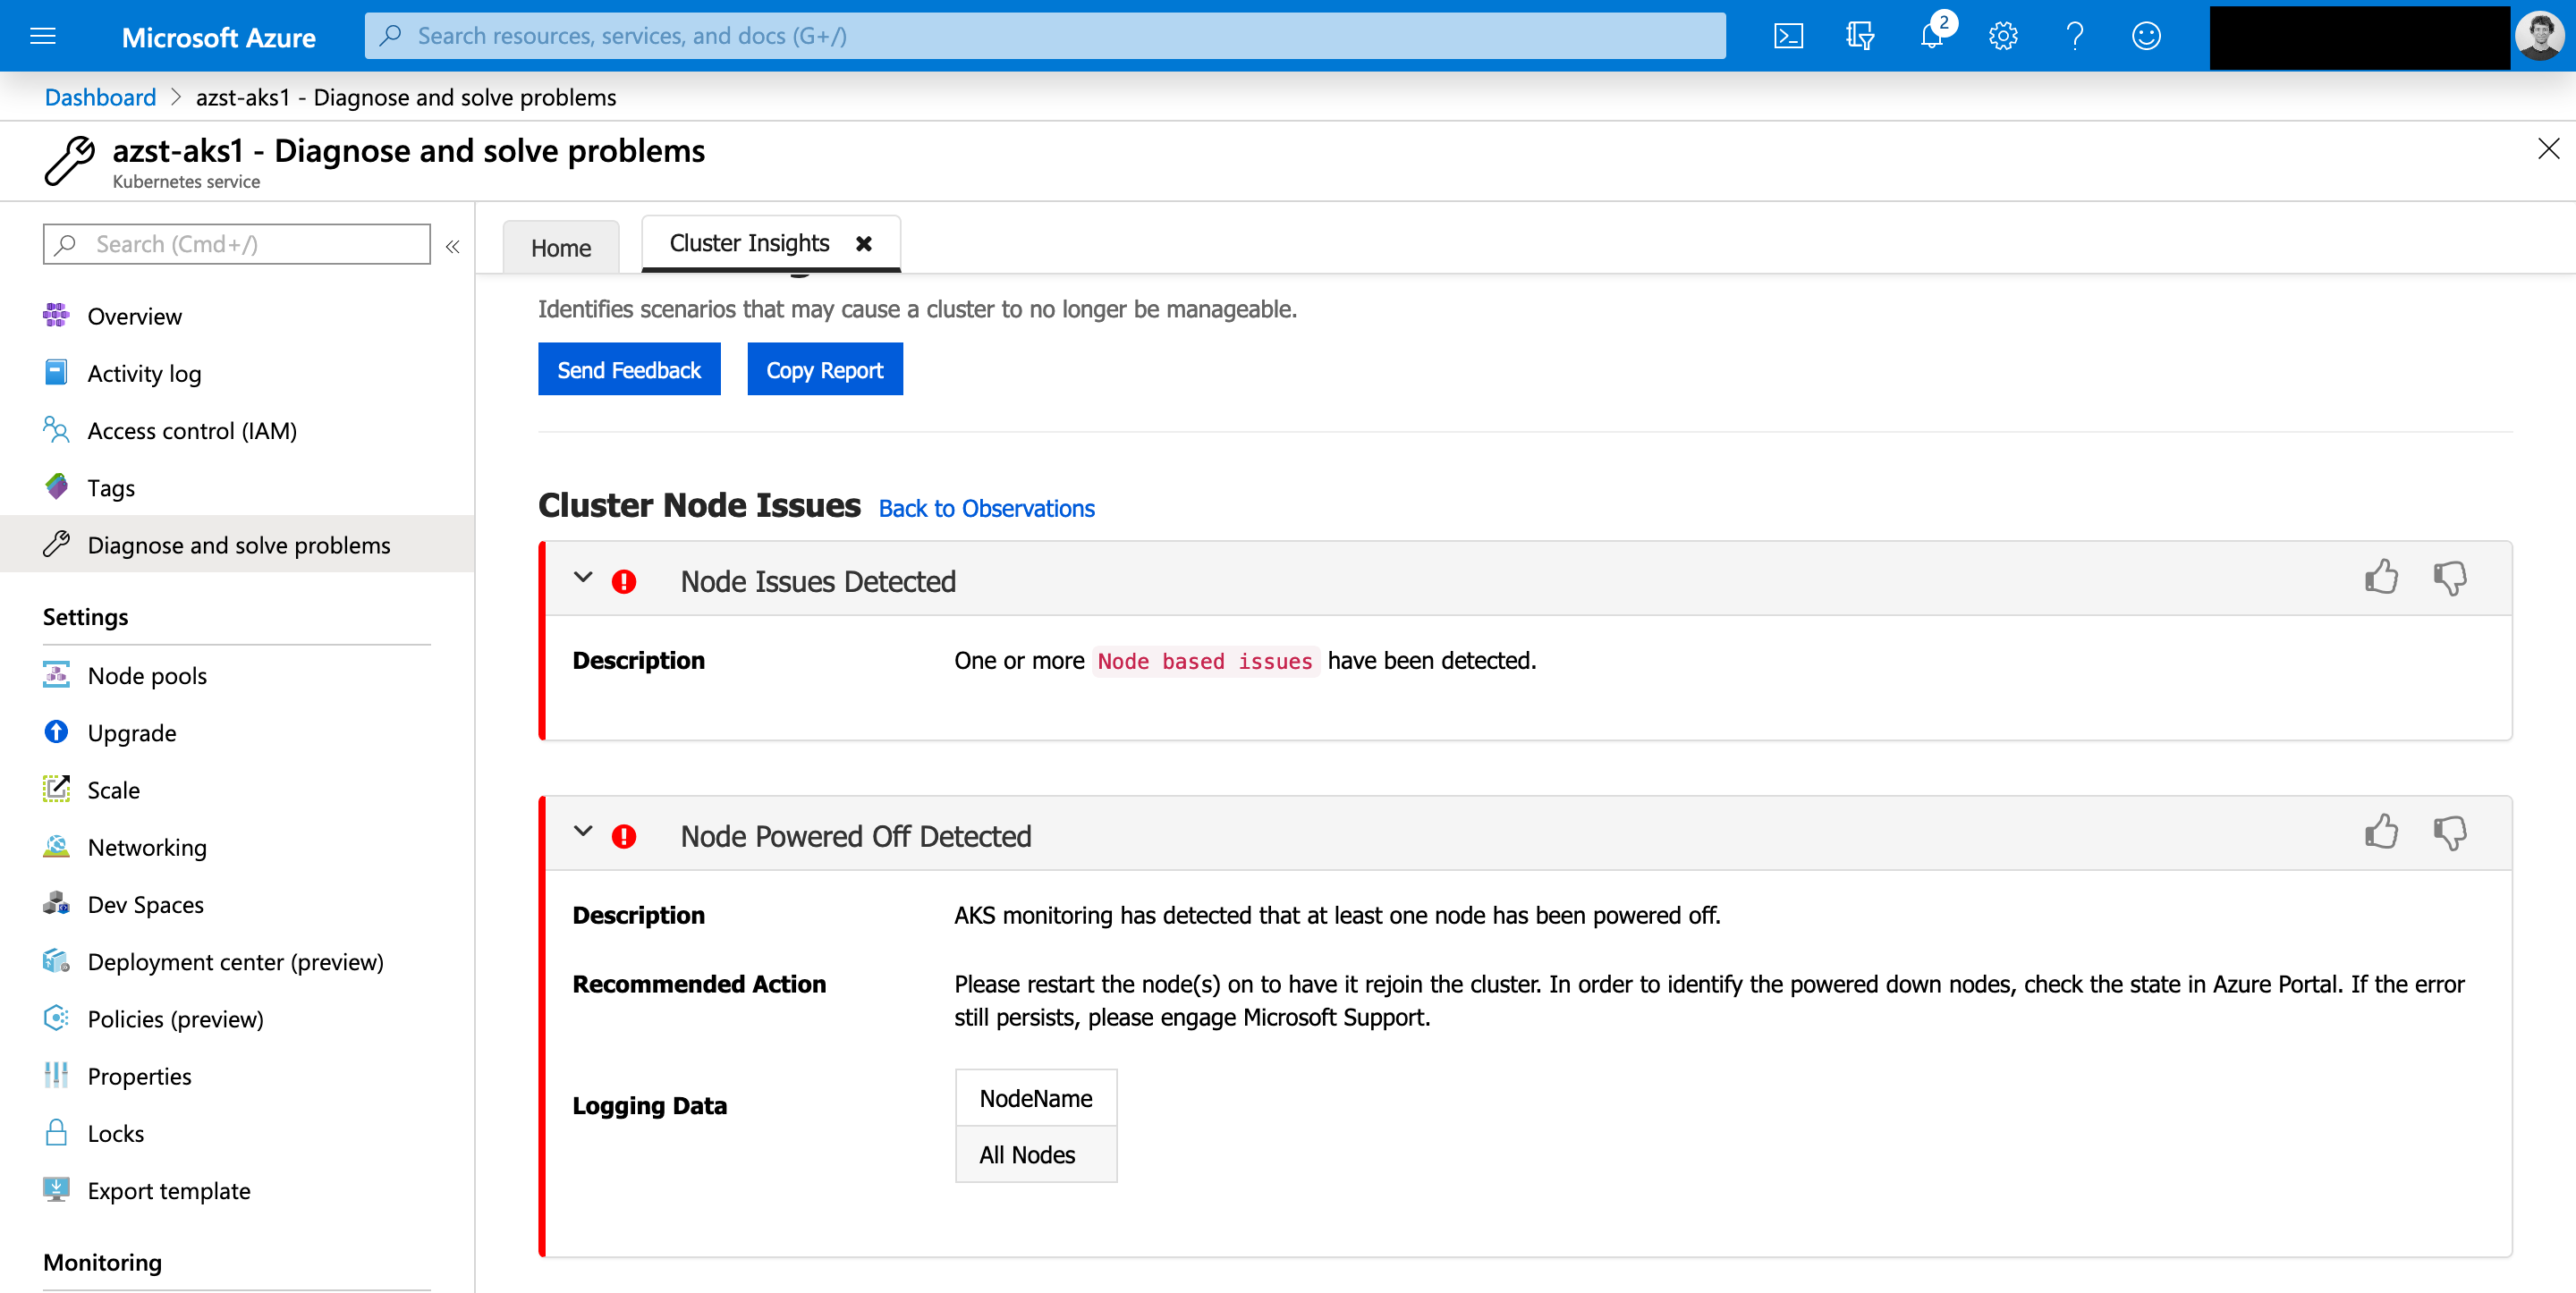
The issue described in the above screenshot can be a regular one, if you are powering down the AKS nodes e.g. in a demo Azure subscription to safe costs. In that case you can ignore the issue and execute the AKS Diagnostics run after 24 hours again. When the scenario I mentioned does not fit your environment, then you should check the state of the AKS nodes and start them if necessary, to solve the issue.